숏
Bearish Symmetric Triangle Inbound!!
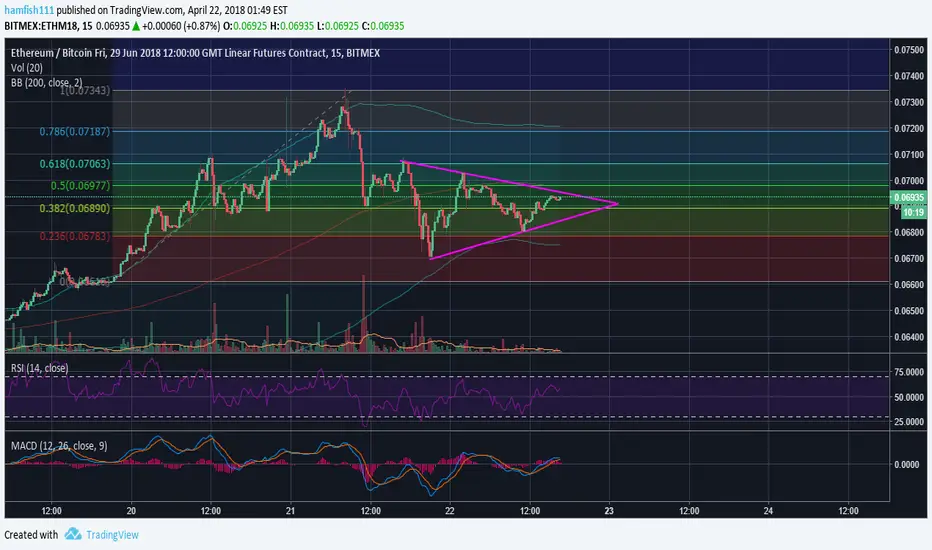
Looking at Ethereum you can see a very noticeable bearish symmetric triangle, some people may get this mixed up with a pennant but the difference between the two is that with a bearish triangle, the price starts from the high point, whereas a pennant starts from the low point.
And also looking at the MACD a crossover seems very possible to the bearish side, and the RSI looks to form a head and shoulders pattern which is also a bearish signal.
Thanks, if you liked my idea dont forget to like it and follow me for more ideas!
And also looking at the MACD a crossover seems very possible to the bearish side, and the RSI looks to form a head and shoulders pattern which is also a bearish signal.
Thanks, if you liked my idea dont forget to like it and follow me for more ideas!
노트
i dont even understand
면책사항
해당 정보와 게시물은 금융, 투자, 트레이딩 또는 기타 유형의 조언이나 권장 사항으로 간주되지 않으며, 트레이딩뷰에서 제공하거나 보증하는 것이 아닙니다. 자세한 내용은 이용 약관을 참조하세요.
면책사항
해당 정보와 게시물은 금융, 투자, 트레이딩 또는 기타 유형의 조언이나 권장 사항으로 간주되지 않으며, 트레이딩뷰에서 제공하거나 보증하는 것이 아닙니다. 자세한 내용은 이용 약관을 참조하세요.