
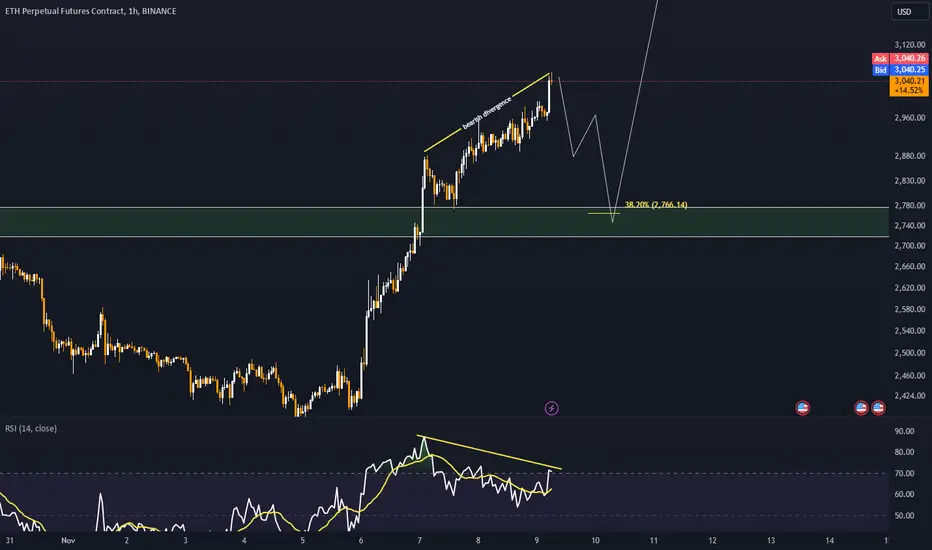
Ethereum is currently displaying signs of a bearish divergence on lower timeframes, a signal that often indicates a potential slowdown in upward momentum and the likelihood of a correction. Despite the bearish signal, the ongoing correction appears to be relatively shallow, suggesting that the underlying bullish structure remains intact.
A retracement to the 0.382 Fibonacci level could present an attractive buying opportunity for traders looking to enter at a lower risk point. This level is often viewed as a key zone for price reactions during corrections, providing a favorable balance between value and momentum for long-term positions.
A retracement to the 0.382 Fibonacci level could present an attractive buying opportunity for traders looking to enter at a lower risk point. This level is often viewed as a key zone for price reactions during corrections, providing a favorable balance between value and momentum for long-term positions.

면책사항
해당 정보와 게시물은 금융, 투자, 트레이딩 또는 기타 유형의 조언이나 권장 사항으로 간주되지 않으며, 트레이딩뷰에서 제공하거나 보증하는 것이 아닙니다. 자세한 내용은 이용 약관을 참조하세요.
면책사항
해당 정보와 게시물은 금융, 투자, 트레이딩 또는 기타 유형의 조언이나 권장 사항으로 간주되지 않으며, 트레이딩뷰에서 제공하거나 보증하는 것이 아닙니다. 자세한 내용은 이용 약관을 참조하세요.