
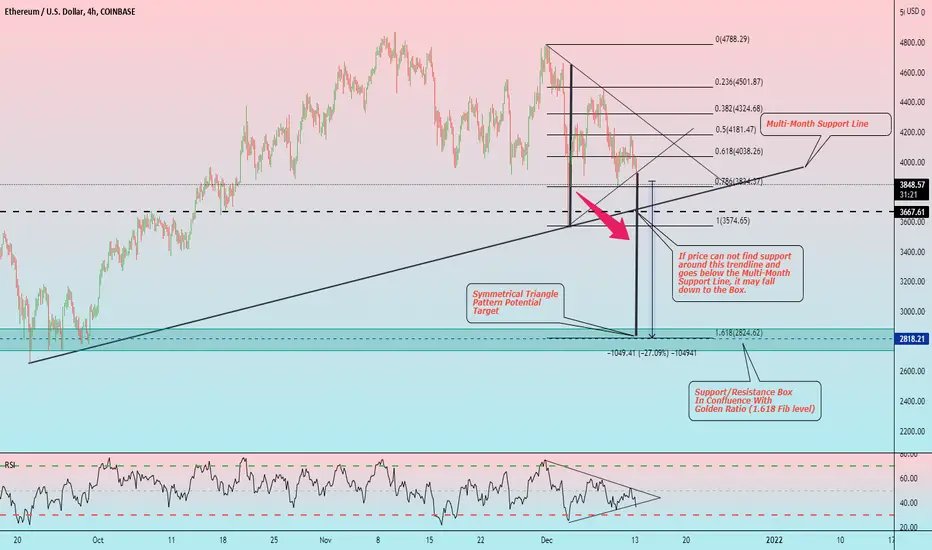
Hello friends, today you can review the technical analysis on a 4H linear scale chart for Ethereum (ETHUSD), a cryptocurrency.
1) The Ethereum price currently broke down from the Symmetrical Triangle Pattern it was forming.
2) If price does not get back into the triangle, it may be supported by a Multi-Month Support Trendline.
3) If that support trendline doesn't hold, it may fall down to the Support and Resistance Area (Box) which is around a 25%-30% price drop.
4) The measured move from the Symmetrical Triangle has the potential to bring the price down to the 1.618 Fibonacci Retracement level. This is also in the Support and Resistance Area.
5) Also note the RSI (relative strength index) also broke down from the bottom support line.
What are your opinions on this?
If you enjoy my ideas, feel free to like it and drop in a comment. I love reading your comments below.
As the year is coming to an end and holidays are almost here. I want to wish my friends Happy Holidays and ready for an exciting 2022! What are your thoughts for the coming year?
Disclosure: This is just my opinion and not any type of financial advice. I enjoy charting and discussing technical analysis . Don't trade based on my advice. Do your own research! #cryptopickk
1) The Ethereum price currently broke down from the Symmetrical Triangle Pattern it was forming.
2) If price does not get back into the triangle, it may be supported by a Multi-Month Support Trendline.
3) If that support trendline doesn't hold, it may fall down to the Support and Resistance Area (Box) which is around a 25%-30% price drop.
4) The measured move from the Symmetrical Triangle has the potential to bring the price down to the 1.618 Fibonacci Retracement level. This is also in the Support and Resistance Area.
5) Also note the RSI (relative strength index) also broke down from the bottom support line.
What are your opinions on this?
If you enjoy my ideas, feel free to like it and drop in a comment. I love reading your comments below.
As the year is coming to an end and holidays are almost here. I want to wish my friends Happy Holidays and ready for an exciting 2022! What are your thoughts for the coming year?
Disclosure: This is just my opinion and not any type of financial advice. I enjoy charting and discussing technical analysis . Don't trade based on my advice. Do your own research! #cryptopickk
노트
Ethereum failed the re-test of the support line on the 4H chart. Possible drop back down. Keep a close eye on volume as well. Do your own research.
관련 발행물
면책사항
해당 정보와 게시물은 금융, 투자, 트레이딩 또는 기타 유형의 조언이나 권장 사항으로 간주되지 않으며, 트레이딩뷰에서 제공하거나 보증하는 것이 아닙니다. 자세한 내용은 이용 약관을 참조하세요.
관련 발행물
면책사항
해당 정보와 게시물은 금융, 투자, 트레이딩 또는 기타 유형의 조언이나 권장 사항으로 간주되지 않으며, 트레이딩뷰에서 제공하거나 보증하는 것이 아닙니다. 자세한 내용은 이용 약관을 참조하세요.