
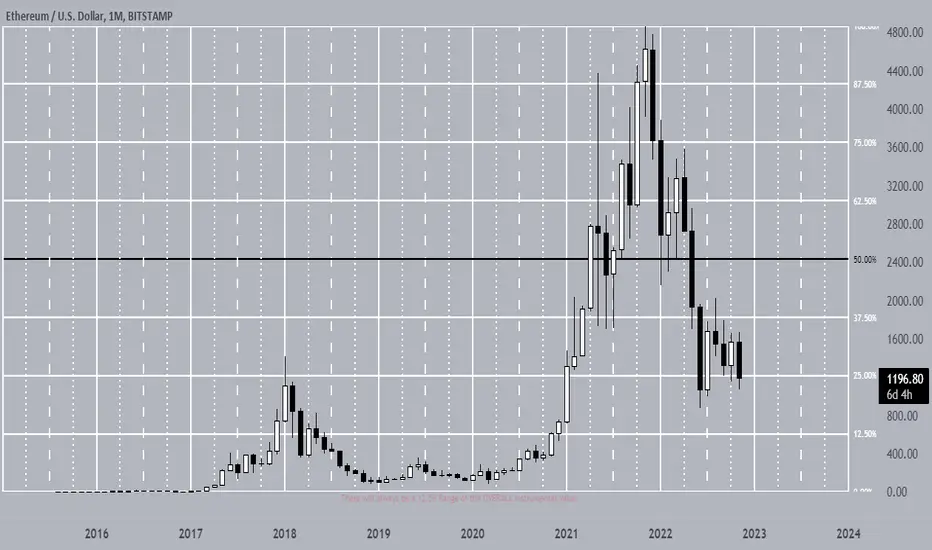
This is a different way for Traders' to look at an Instruments Levels' and Quarterly Candles' (3M TF) Ranges of Liquidity, throughout a Yearly Candle's Range. Being able to understand how a Candle Opens, Accumulates Liquidity, Manipulates Liquidity, and then Distributes (Delivers) that Liquidity into the Closing Range, is what will give you the edge your looking for no matter what Time Frame you are Trading on whether it be a 12 month Chart or a 5 min Chart; all candle's do the same thing in slightly different ways: OHLC or OLHC. Instead of using the stock Horizontal and Vertical Grid ive decided to design this super simplistic "Liquidity Block Grid" to help identify the Weekly and Daily Bias a bit easier. Keep in mind to use ALL of the Data supplied by the Instrument for this Method OR Scale this method down to a single Yearly Candle and tear apart the Individual Months, Weeks, and Days using the same exact concept to help Identify the Hourly Bias for single session trading. Also this concept works on EVERY INSTRUMENT NOT JUST CRYPTO! It is just very easy to describe on Ethereum Data IMO.

면책사항
해당 정보와 게시물은 금융, 투자, 트레이딩 또는 기타 유형의 조언이나 권장 사항으로 간주되지 않으며, 트레이딩뷰에서 제공하거나 보증하는 것이 아닙니다. 자세한 내용은 이용 약관을 참조하세요.
면책사항
해당 정보와 게시물은 금융, 투자, 트레이딩 또는 기타 유형의 조언이나 권장 사항으로 간주되지 않으며, 트레이딩뷰에서 제공하거나 보증하는 것이 아닙니다. 자세한 내용은 이용 약관을 참조하세요.