
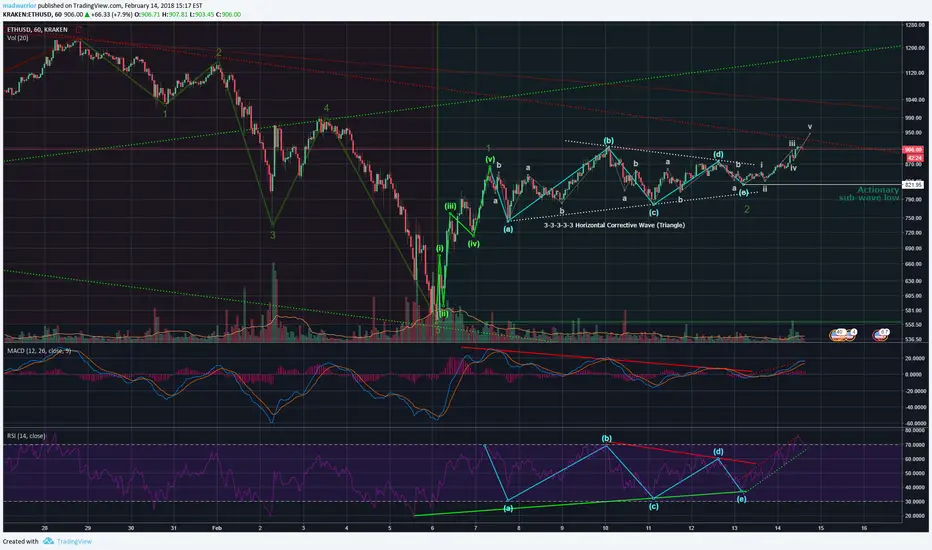
We have a plausible wave count that shows signs of a possible completion of the larger degree correction, and sub-waves 1 and 2 of a larger degree impulse wave. The sub-waves consist of an impulse wave and a horizontal correction (triangle pattern).
We are currently inside an impulse wave, shown in the light gray, where the wave count is not confirmed yet. There is likely to be a correction wave coming up once the impulse wave is complete, but as long as it doesn't retrace more than 100% of wave 1 (which is around 822 levels), then the wave count will remain valid as well as the uptrend. In the case that the upcoming correction does drop below this level, then a Elliott Double Combo wave (WXY) might form where ETH might retry for an impulse wave, or in the more extreme case, cause the continuation of a larger degree downtrend.
노트
I have adjusted the wave count here:There is a possible ABC correction in progress (shown by the gray lines). The c wave might bottom out around the low of wave iv (900 levels) before commencing another impulse wave shown by the lime green lines. However, this correction may retrace further than the wave iv low but that is less likely. If it does than it will need to hold above the "actionary" wave low at around 830 to withhold the uptrend. Otherwise, the downtrend will continue in the larger degree.
노트
Update included in screenshot:노트
Update: Scenario 1 is out of question now that wave e has been confirmed; watch for a bounce.
관련 발행물
면책사항
해당 정보와 게시물은 금융, 투자, 트레이딩 또는 기타 유형의 조언이나 권장 사항으로 간주되지 않으며, 트레이딩뷰에서 제공하거나 보증하는 것이 아닙니다. 자세한 내용은 이용 약관을 참조하세요.
면책사항
해당 정보와 게시물은 금융, 투자, 트레이딩 또는 기타 유형의 조언이나 권장 사항으로 간주되지 않으며, 트레이딩뷰에서 제공하거나 보증하는 것이 아닙니다. 자세한 내용은 이용 약관을 참조하세요.