
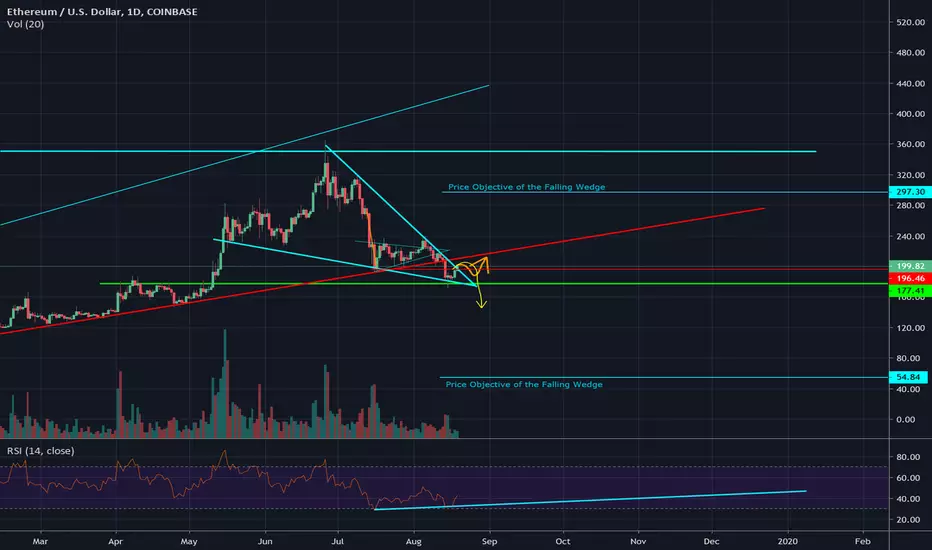
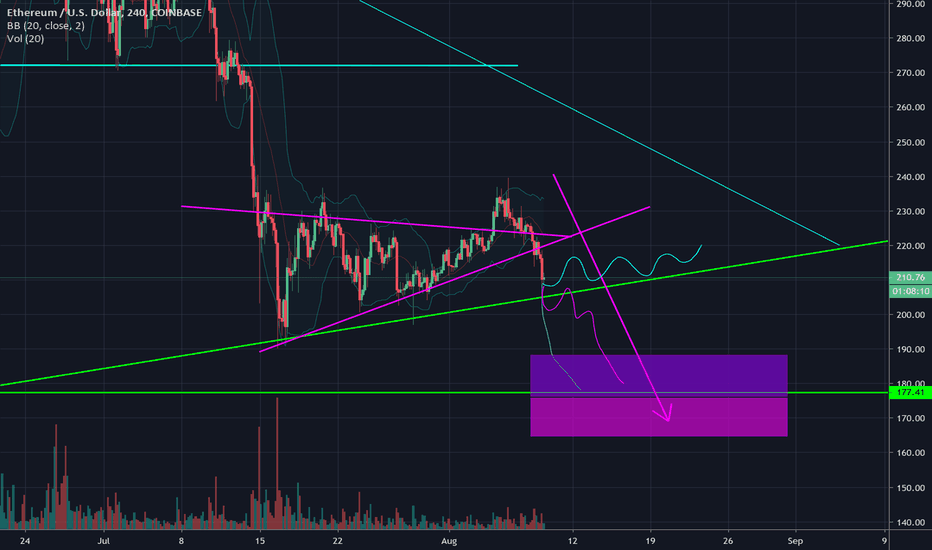
In the previous analysis, the price hit the support of 170 which was indicated to be a strong support area and price reacted very bullishly. The last analysis was more on bearish given that it had already broken out of a pattern. Currently, I am seeing a lot of these falling wedges which are naturally indicative as a very bullish continuation pattern.
The Chart:
The falling wedge is presented in light blue; it has falling volume which is a sign of consolidation. The price objectives are given in horizontal lines of the same light blue. There is a horizontal trendline that may act like resistance temporarily, but if this breaks upwards, it would have been a bear trap, and this small break of the trendline would be a spring given how low volume it was. (For springs or bear traps high volume springs are not as bullish as a low volume spring). In addition, there is a tentative trendline occurring on the RSI, which could turn into a true trend once there is one more touch to that trendline.
Possible Price Actions:
Since Ethereum has already broken my top trendline, I am expecting a small consolidation and a retest of that top trendline, this represented with the thick orange arrow. If the defense of that trendline is successful, then it will most likely blast through 200 very easily. Another possibility is that the top trendline of the wedge is not successful and price continues its downward direction which is represented by the yellow arrow.
Previous Analysis:
The Chart:
The falling wedge is presented in light blue; it has falling volume which is a sign of consolidation. The price objectives are given in horizontal lines of the same light blue. There is a horizontal trendline that may act like resistance temporarily, but if this breaks upwards, it would have been a bear trap, and this small break of the trendline would be a spring given how low volume it was. (For springs or bear traps high volume springs are not as bullish as a low volume spring). In addition, there is a tentative trendline occurring on the RSI, which could turn into a true trend once there is one more touch to that trendline.
Possible Price Actions:
Since Ethereum has already broken my top trendline, I am expecting a small consolidation and a retest of that top trendline, this represented with the thick orange arrow. If the defense of that trendline is successful, then it will most likely blast through 200 very easily. Another possibility is that the top trendline of the wedge is not successful and price continues its downward direction which is represented by the yellow arrow.
Previous Analysis:

면책사항
해당 정보와 게시물은 금융, 투자, 트레이딩 또는 기타 유형의 조언이나 권장 사항으로 간주되지 않으며, 트레이딩뷰에서 제공하거나 보증하는 것이 아닙니다. 자세한 내용은 이용 약관을 참조하세요.
면책사항
해당 정보와 게시물은 금융, 투자, 트레이딩 또는 기타 유형의 조언이나 권장 사항으로 간주되지 않으며, 트레이딩뷰에서 제공하거나 보증하는 것이 아닙니다. 자세한 내용은 이용 약관을 참조하세요.