
Analysis
Projections
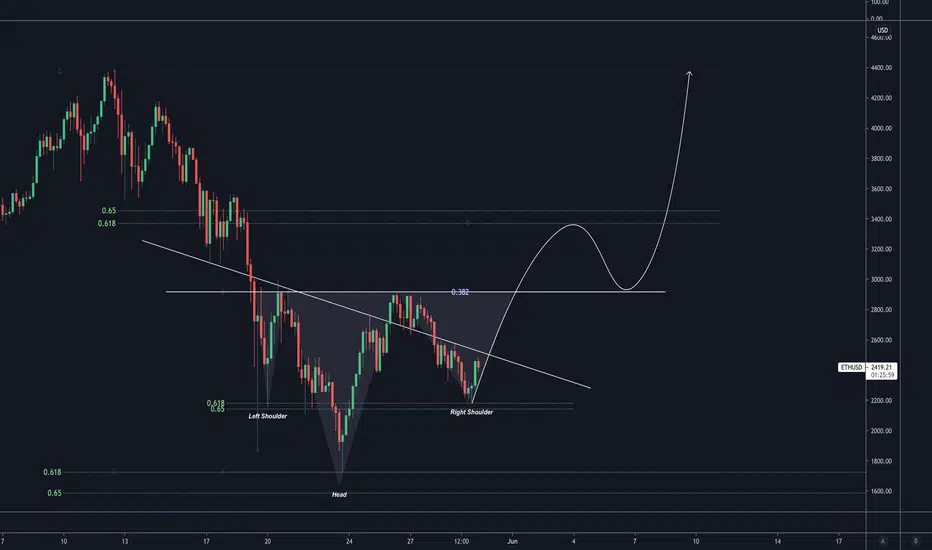
Conclusion: Price has crashed severely and has consolidated healthily by ranging sideways. The bottom is in and the next move up will form the right shoulder and break past resistance at $3000 to push for $3400
2017 Fractal[/I]
- We may be at the point where the crash is over and the bull market is about to resume again
- We are in the midst of fully printing an inverted head and shoulders pattern with the right shoulder about to finish forming
- Current price has retraced and bounced from the local right-shoulder 61.8% fibonacci retracement level
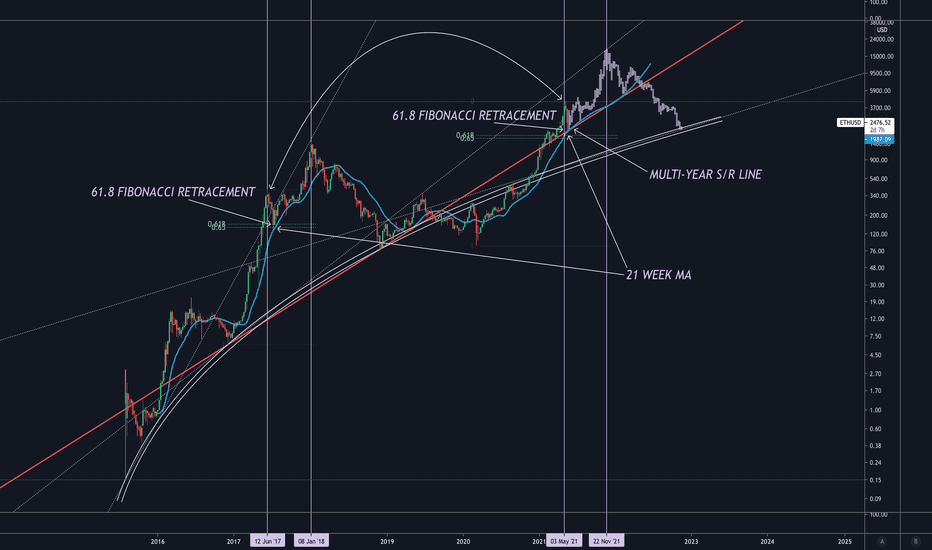
- The entire correction, from Ethereum's cycle ATL to the ATH, has retraced to the 61.8% fibonacci retracement level
- Price action has been very healthy by consolidating and maintaining a low prices by winding between $2000-$3000, which supports the argument of a bottom being formed
- This is largely supportive of the 2017 fractal idea linked below which indicates that price has found a bottom
Projections
- I suspect we have bottomed and this 61.8% fibonacci retracement as the right shoulder will be a reversal zone to break past $3000, the neckline and local resistance zone
- We will find rejection at the ATH-Bottom 61.8% retracement level at $3,400 and correct to the 38.2% level to retest the neck-line to turn resistance to support before fighting for an ATH
Conclusion: Price has crashed severely and has consolidated healthily by ranging sideways. The bottom is in and the next move up will form the right shoulder and break past resistance at $3000 to push for $3400
2017 Fractal[/I]

관련 발행물
면책사항
해당 정보와 게시물은 금융, 투자, 트레이딩 또는 기타 유형의 조언이나 권장 사항으로 간주되지 않으며, 트레이딩뷰에서 제공하거나 보증하는 것이 아닙니다. 자세한 내용은 이용 약관을 참조하세요.
면책사항
해당 정보와 게시물은 금융, 투자, 트레이딩 또는 기타 유형의 조언이나 권장 사항으로 간주되지 않으며, 트레이딩뷰에서 제공하거나 보증하는 것이 아닙니다. 자세한 내용은 이용 약관을 참조하세요.