
Hello Traders,
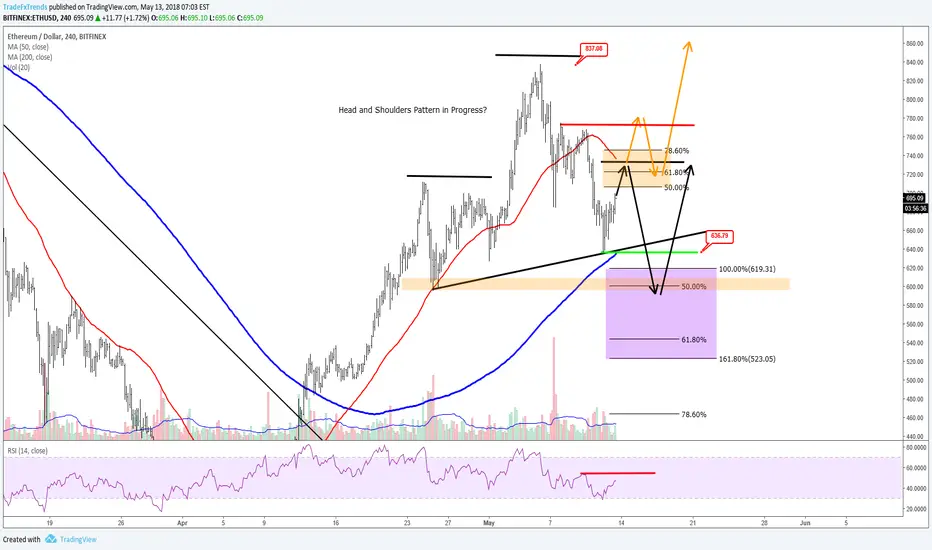
ETHUSD is in a sideways range between 837.08-636.79.
I am looking for a potential head and shoulders pattern. But the right shoulder is currently in progress.
I am looking at 2 possible scenarios drawn in the chart.
The first is the black one, in case the head and shoulders pattern get confirmed I would be looking for more downside. The second one is the orange one. As long as it stays above 636.79 there is a chance that the market just keeps extending higher. Let's see.
Disclaimer: Trading is about going with the highest probability, nobody is 100% right and we need to protect ourself in case we are wrong. That is why we need to always use a stop-loss when trading. Trade with care. This my current view, and any view present is not a trading recommendation just personal view.
Hope this helps.
ETHUSD is in a sideways range between 837.08-636.79.
I am looking for a potential head and shoulders pattern. But the right shoulder is currently in progress.
I am looking at 2 possible scenarios drawn in the chart.
The first is the black one, in case the head and shoulders pattern get confirmed I would be looking for more downside. The second one is the orange one. As long as it stays above 636.79 there is a chance that the market just keeps extending higher. Let's see.
Disclaimer: Trading is about going with the highest probability, nobody is 100% right and we need to protect ourself in case we are wrong. That is why we need to always use a stop-loss when trading. Trade with care. This my current view, and any view present is not a trading recommendation just personal view.
Hope this helps.
노트
Good morning everyone, so far so good. 노트
Still at its decision area.... 노트
I told you guys that the move lower can be seen. 노트

면책사항
해당 정보와 게시물은 금융, 투자, 트레이딩 또는 기타 유형의 조언이나 권장 사항으로 간주되지 않으며, 트레이딩뷰에서 제공하거나 보증하는 것이 아닙니다. 자세한 내용은 이용 약관을 참조하세요.
면책사항
해당 정보와 게시물은 금융, 투자, 트레이딩 또는 기타 유형의 조언이나 권장 사항으로 간주되지 않으며, 트레이딩뷰에서 제공하거나 보증하는 것이 아닙니다. 자세한 내용은 이용 약관을 참조하세요.