
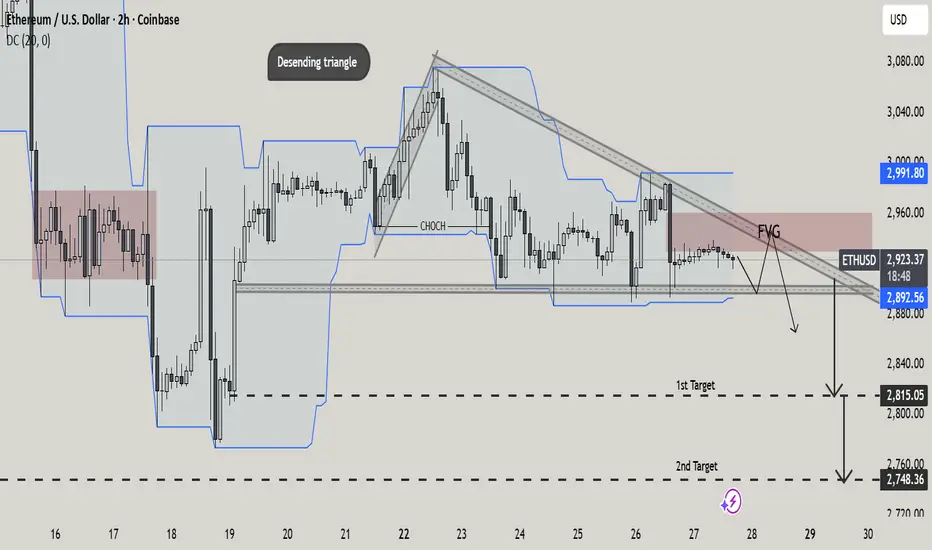
This 2H ETH/USD chart highlights a descending triangle structure forming after a prior impulse move. Price is consistently making lower highs beneath a descending trendline, while holding a horizontal support zone around 2,890–2,900, signaling growing bearish pressure.
A clear CHoCH (Change of Character) confirms the shift in market structure from bullish to bearish. Price is currently trading below key dynamic resistance and within a marked Fair Value Gap (FVG), suggesting a potential rejection area before continuation lower.
The projected downside targets are:
1st Target: ~2,815 (liquidity sweep / prior support)
2nd Target: ~2,748 (major demand zone)
Overall, the chart presents a classic bearish continuation setup, favoring downside expansion if support breaks with confirmation.
A clear CHoCH (Change of Character) confirms the shift in market structure from bullish to bearish. Price is currently trading below key dynamic resistance and within a marked Fair Value Gap (FVG), suggesting a potential rejection area before continuation lower.
The projected downside targets are:
1st Target: ~2,815 (liquidity sweep / prior support)
2nd Target: ~2,748 (major demand zone)
Overall, the chart presents a classic bearish continuation setup, favoring downside expansion if support breaks with confirmation.

telegram channel link
t.me/+4HnhYAZNJ-lhNmY0
join to get daily basis 2-3 free signal for educational purpose
t.me/+4HnhYAZNJ-lhNmY0
you tube channel for trading education
youtube.com/@ALPHA_TRADE_SCOPE
t.me/+4HnhYAZNJ-lhNmY0
join to get daily basis 2-3 free signal for educational purpose
t.me/+4HnhYAZNJ-lhNmY0
you tube channel for trading education
youtube.com/@ALPHA_TRADE_SCOPE
관련 발행물
면책사항
해당 정보와 게시물은 금융, 투자, 트레이딩 또는 기타 유형의 조언이나 권장 사항으로 간주되지 않으며, 트레이딩뷰에서 제공하거나 보증하는 것이 아닙니다. 자세한 내용은 이용 약관을 참조하세요.
telegram channel link
t.me/+4HnhYAZNJ-lhNmY0
join to get daily basis 2-3 free signal for educational purpose
t.me/+4HnhYAZNJ-lhNmY0
you tube channel for trading education
youtube.com/@ALPHA_TRADE_SCOPE
t.me/+4HnhYAZNJ-lhNmY0
join to get daily basis 2-3 free signal for educational purpose
t.me/+4HnhYAZNJ-lhNmY0
you tube channel for trading education
youtube.com/@ALPHA_TRADE_SCOPE
관련 발행물
면책사항
해당 정보와 게시물은 금융, 투자, 트레이딩 또는 기타 유형의 조언이나 권장 사항으로 간주되지 않으며, 트레이딩뷰에서 제공하거나 보증하는 것이 아닙니다. 자세한 내용은 이용 약관을 참조하세요.