 ETHUSD
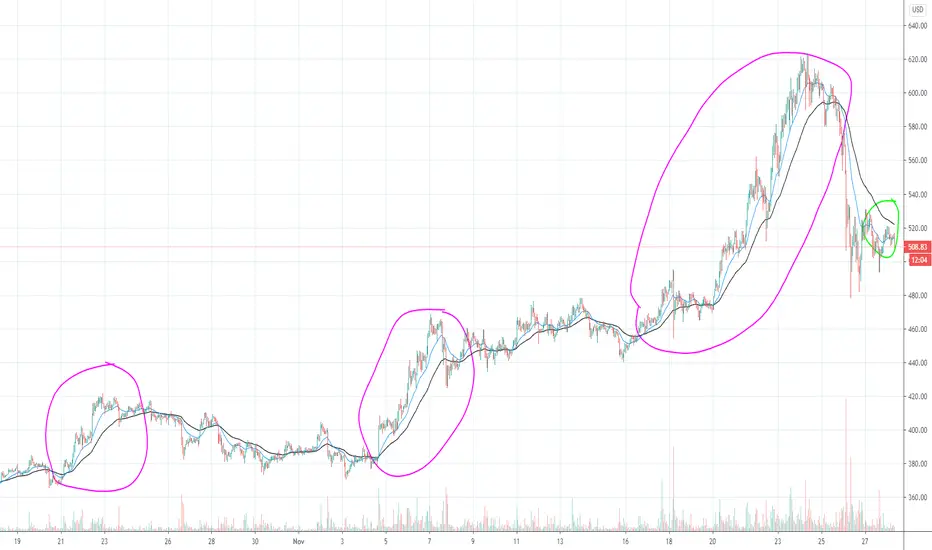
 Here is some more analysis using EMAs looking at 1 hour candles.
You can see with each pink circle, once the EMA20 (blue line) crosses above the EMA50 (black line) we enter a bullish period. This spike continues until EMAs even out and the EMA50 crosses back over. Looking at the green circle we see EMA50 is currently still above, once that turns we are bullish.
These two EMAs are very standard for cryptocurrency analysis.
This is not financial advice! Please trade at your own risk.

면책사항
해당 정보와 게시물은 금융, 투자, 트레이딩 또는 기타 유형의 조언이나 권장 사항으로 간주되지 않으며, 트레이딩뷰에서 제공하거나 보증하는 것이 아닙니다. 자세한 내용은 이용 약관을 참조하세요.
면책사항
해당 정보와 게시물은 금융, 투자, 트레이딩 또는 기타 유형의 조언이나 권장 사항으로 간주되지 않으며, 트레이딩뷰에서 제공하거나 보증하는 것이 아닙니다. 자세한 내용은 이용 약관을 참조하세요.