
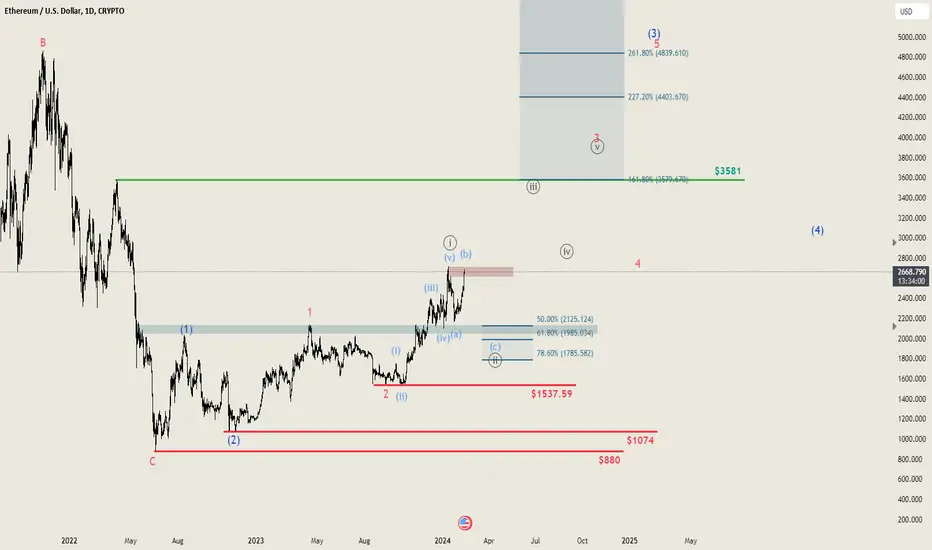
Like other cryptocurrencies, Ethereum has recently experienced a sharp increase that exceeded our expectations, prompting us to reassess our initial scenario. Initially, we anticipated another correction downwards to complete our premiere scenario.
Upon reevaluation of the daily chart, it appears we might be in the overarching blue Wave (3). However, a closer look suggests we've completed the Wave ((i)) and are now facing an ABC correction towards a Wave ((ii)). This assessment is based on the clear structure observed.

The 2-hour chart does not indicate a discernible Wave 2 thus far. Therefore, we presume we're in the correction phase of Wave ((ii)), as long as the $3,000 mark isn't surpassed. Breaking this threshold would necessitate a reevaluation of our scenario, though this is deemed unlikely until the expected correction occurs.
Following this correction, we anticipate that the subordinate Wave 3 of the overarching Wave (3) will reach the $3,580 level. Subsequently, the price should aim for our target range of $4,300 to $5,000.
In summary, as long as we do not exceed the 138% level, namely the $3,000 mark, on the 2-hour chart, we expect a five-part wave structure downward leading to a Wave C/Wave 2.
Upon reevaluation of the daily chart, it appears we might be in the overarching blue Wave (3). However, a closer look suggests we've completed the Wave ((i)) and are now facing an ABC correction towards a Wave ((ii)). This assessment is based on the clear structure observed.
The 2-hour chart does not indicate a discernible Wave 2 thus far. Therefore, we presume we're in the correction phase of Wave ((ii)), as long as the $3,000 mark isn't surpassed. Breaking this threshold would necessitate a reevaluation of our scenario, though this is deemed unlikely until the expected correction occurs.
Following this correction, we anticipate that the subordinate Wave 3 of the overarching Wave (3) will reach the $3,580 level. Subsequently, the price should aim for our target range of $4,300 to $5,000.
In summary, as long as we do not exceed the 138% level, namely the $3,000 mark, on the 2-hour chart, we expect a five-part wave structure downward leading to a Wave C/Wave 2.
주문취소됨
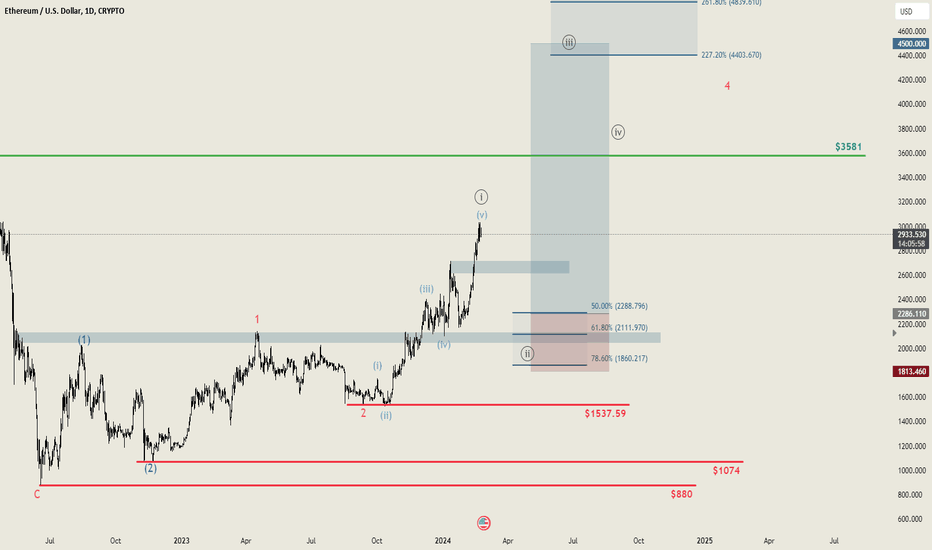
We've changed our scenario, please check the new analysis⬇️⬇️

관련 발행물
면책사항
해당 정보와 게시물은 금융, 투자, 트레이딩 또는 기타 유형의 조언이나 권장 사항으로 간주되지 않으며, 트레이딩뷰에서 제공하거나 보증하는 것이 아닙니다. 자세한 내용은 이용 약관을 참조하세요.
면책사항
해당 정보와 게시물은 금융, 투자, 트레이딩 또는 기타 유형의 조언이나 권장 사항으로 간주되지 않으며, 트레이딩뷰에서 제공하거나 보증하는 것이 아닙니다. 자세한 내용은 이용 약관을 참조하세요.