
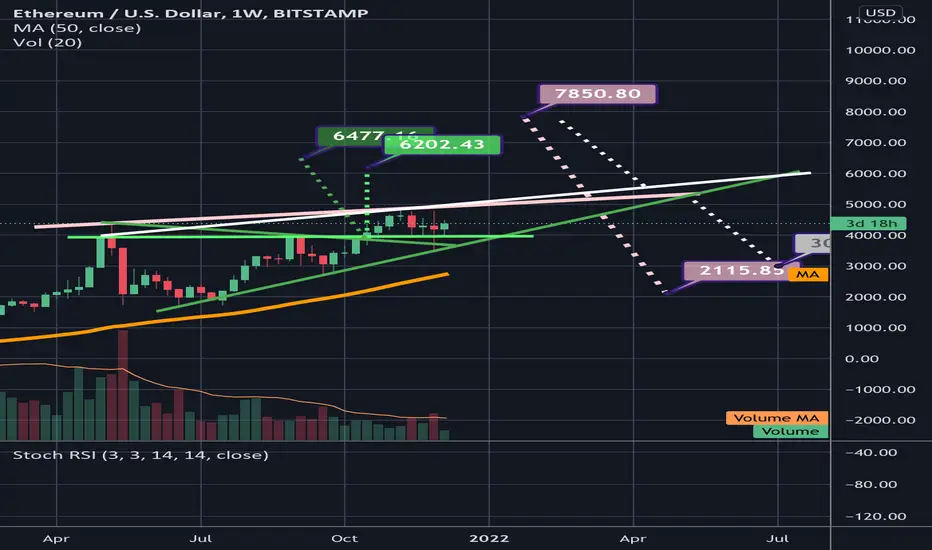
I’m keeping this neutral until we see confirmation either up or down. These are the current trend lines in play on eth usd. We can see we have two potential bullish continuation triangle patterns: A potential symmetrical triangle and a potential ascending triangle. We also have a bearish rising wedge in play, with the possibility of two potential top trendline s to that rising wedge…the bottom trendline seems very defined at this point. As we have seen already multiple times in the bull market, sometimes we actually break upward from rising wedges in a bull market. So I have posted the measured move targets or if we break down from the wedge but also if we break up from the wedge as well. We are currently confirming the symmetrical triangle and ascending triangles top trendline s as support which is a win for the bulls as long as we maintain that support…however that will be much more likely to be sustained once we can overcome the two potential top trendlines of the wedge and flip them to support. or now I must remain neutral, for even though I am overall bullish on eth, btc and the majority of the crypto market…one black swan event could easily interrupt it with a bearish plummet in price action.

면책사항
해당 정보와 게시물은 금융, 투자, 트레이딩 또는 기타 유형의 조언이나 권장 사항으로 간주되지 않으며, 트레이딩뷰에서 제공하거나 보증하는 것이 아닙니다. 자세한 내용은 이용 약관을 참조하세요.
면책사항
해당 정보와 게시물은 금융, 투자, 트레이딩 또는 기타 유형의 조언이나 권장 사항으로 간주되지 않으며, 트레이딩뷰에서 제공하거나 보증하는 것이 아닙니다. 자세한 내용은 이용 약관을 참조하세요.