
What's up traders,
Let's analyze ETH/USD on the 4H chart.
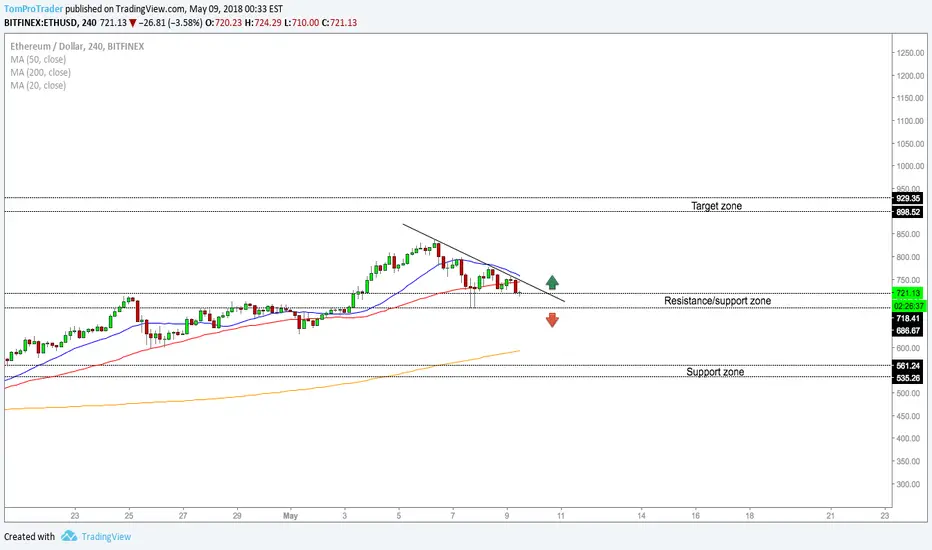
Analyzing the 4 hour chart, price clearly broke the resistance zone and retested it as we predicted in my previous analysis (See related ideas below this idea for more information of this analysis), which could now be a significant pivot point for more upside. Price will now either test the original resistance zone as a new support level and bounce up to the higher target level at 899, or fail at the new support zone and fall back into the lows where there is potential for a low at 558 before more upside. If price fails below the new support zone however, there is a few support levels likely to be hit before hiting the ultimate low. Most notably the 200 major moving average support at 590.
Ethereum is above a major resistance which is potentially support, as well as a potential flag set up which perfectly coincides with this set up. If price stays above the resistance line turned support, then an entry about the flag resistance line is logical, at 737, with a view of reaching 895.
I will update this analysis when I receive above 40 likes.
Let's analyze ETH/USD on the 4H chart.
Analyzing the 4 hour chart, price clearly broke the resistance zone and retested it as we predicted in my previous analysis (See related ideas below this idea for more information of this analysis), which could now be a significant pivot point for more upside. Price will now either test the original resistance zone as a new support level and bounce up to the higher target level at 899, or fail at the new support zone and fall back into the lows where there is potential for a low at 558 before more upside. If price fails below the new support zone however, there is a few support levels likely to be hit before hiting the ultimate low. Most notably the 200 major moving average support at 590.
Ethereum is above a major resistance which is potentially support, as well as a potential flag set up which perfectly coincides with this set up. If price stays above the resistance line turned support, then an entry about the flag resistance line is logical, at 737, with a view of reaching 895.
I will update this analysis when I receive above 40 likes.

관련 발행물
면책사항
해당 정보와 게시물은 금융, 투자, 트레이딩 또는 기타 유형의 조언이나 권장 사항으로 간주되지 않으며, 트레이딩뷰에서 제공하거나 보증하는 것이 아닙니다. 자세한 내용은 이용 약관을 참조하세요.
면책사항
해당 정보와 게시물은 금융, 투자, 트레이딩 또는 기타 유형의 조언이나 권장 사항으로 간주되지 않으며, 트레이딩뷰에서 제공하거나 보증하는 것이 아닙니다. 자세한 내용은 이용 약관을 참조하세요.