
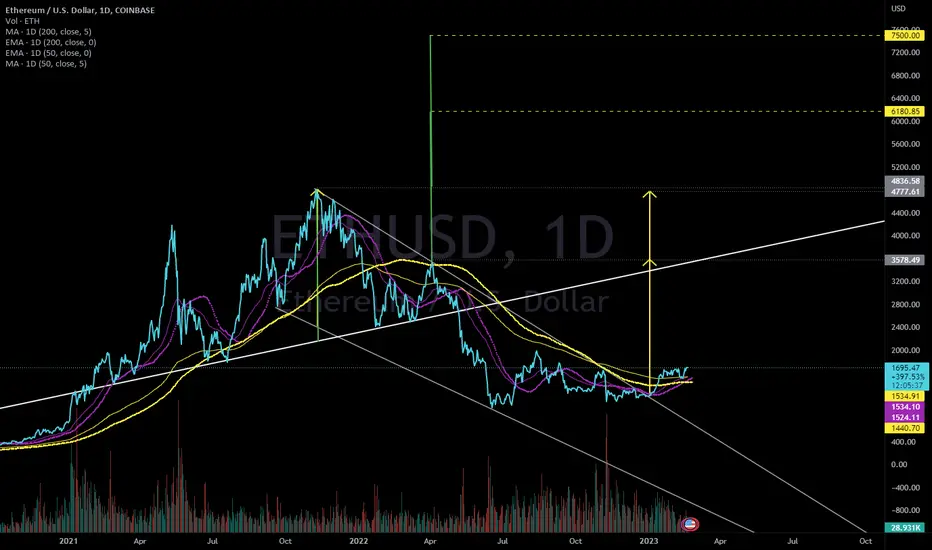
Ethereum broke out of a falling wedge and is showing a golden cross on the 50/200 day MA (dotted), and approaching the same on the 50/200 EMA.
Its falling wedge TP 1 lies right around the neckline of a Head and Shoulders pattern that we fell below during Spring of 2022, as well as the right shoulder.
Falling wedge TP 2 lies just near previous ATH. Get above right shoulder to trigger failed HS, get above ATH to head to 6180 and ultimately 7500.
Note - a successful HS would take Eth back to 0 on its first measured target, so which is more likely - 0 or 7500 following the swap to proof of stake?
Its falling wedge TP 1 lies right around the neckline of a Head and Shoulders pattern that we fell below during Spring of 2022, as well as the right shoulder.
Falling wedge TP 2 lies just near previous ATH. Get above right shoulder to trigger failed HS, get above ATH to head to 6180 and ultimately 7500.
Note - a successful HS would take Eth back to 0 on its first measured target, so which is more likely - 0 or 7500 following the swap to proof of stake?
노트
Seeing a lot a bearish posts on ETH, but it's doing what BTC and everything else has been - broke out of a long-term falling wedge, moved up, golden cross on 50/200 day MA, successfully stayed above both on a re-test, now a 50/200 day EMA golden cross as well:
면책사항
해당 정보와 게시물은 금융, 투자, 트레이딩 또는 기타 유형의 조언이나 권장 사항으로 간주되지 않으며, 트레이딩뷰에서 제공하거나 보증하는 것이 아닙니다. 자세한 내용은 이용 약관을 참조하세요.
면책사항
해당 정보와 게시물은 금융, 투자, 트레이딩 또는 기타 유형의 조언이나 권장 사항으로 간주되지 않으며, 트레이딩뷰에서 제공하거나 보증하는 것이 아닙니다. 자세한 내용은 이용 약관을 참조하세요.