
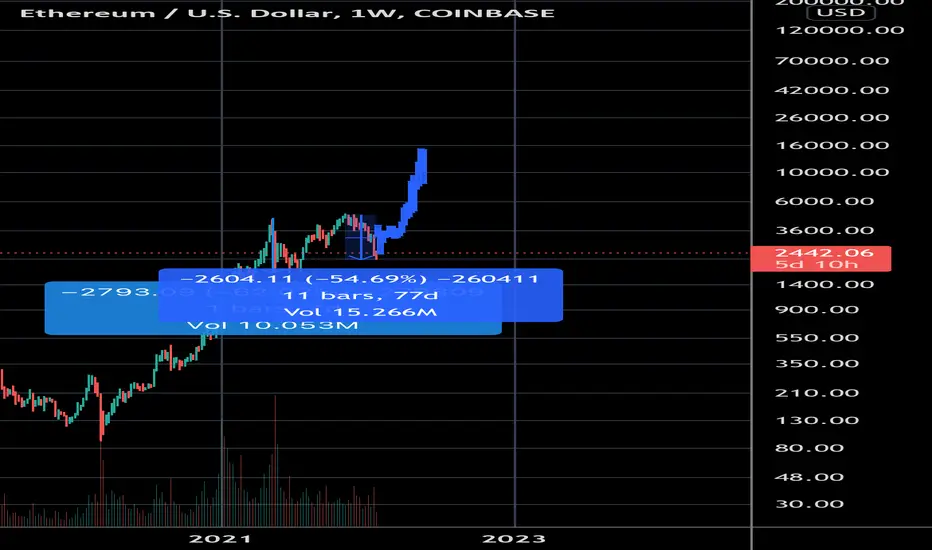
During the 2017 run up to the early 2018 blow off top, ETH had two “crashes” of -69% and -47%, before proceeding to do another 600% pump over a ~110 day period. During the recent cycle, we have experienced two “crashes” of -62% and -54% - if the same fractal / pattern plays out, $16,000 USD ETH can be on table by Q2 2022.

면책사항
해당 정보와 게시물은 금융, 투자, 트레이딩 또는 기타 유형의 조언이나 권장 사항으로 간주되지 않으며, 트레이딩뷰에서 제공하거나 보증하는 것이 아닙니다. 자세한 내용은 이용 약관을 참조하세요.
면책사항
해당 정보와 게시물은 금융, 투자, 트레이딩 또는 기타 유형의 조언이나 권장 사항으로 간주되지 않으며, 트레이딩뷰에서 제공하거나 보증하는 것이 아닙니다. 자세한 내용은 이용 약관을 참조하세요.