
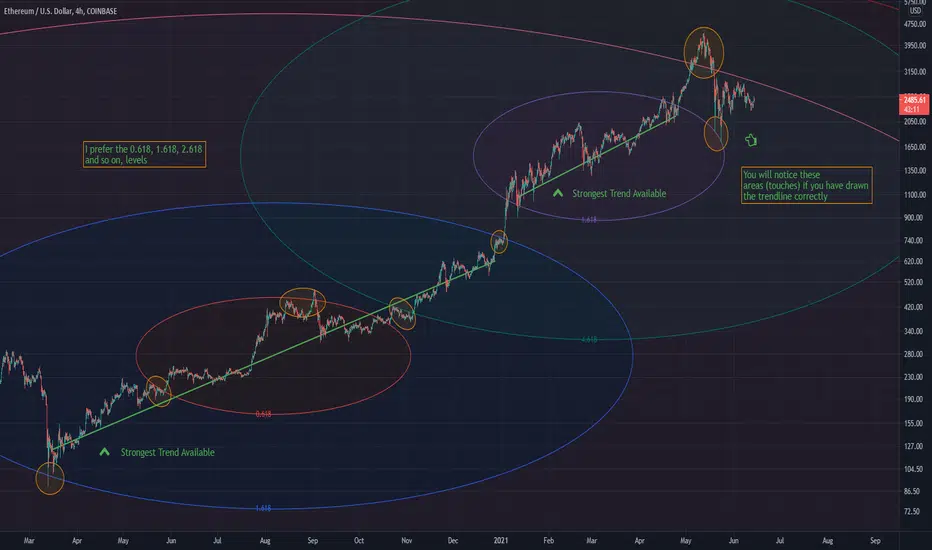
A guide for Fib circles
1 - Draw the trendline
2 - look for areas of confluence around the circle at levels for example 0.618, 1.618, 2.618, 3.618 ...
3 - Make an assessment
This is the 4Hour chart for Ethereum and isn't as reliable as using a higher timeframe, say drawing the trendlines through the entire bear market on the weekly for Ethereum would be more effective. Regardless it still serves its purpose.
This is little data for the current bull run.
This trendline drawing can be applied to any (weekly preferable) chart and assessments can be made based on the position of the price, above or below a key Fib level E.g (0.618)
Hope this helps aspiring chartists

1 - Draw the trendline
2 - look for areas of confluence around the circle at levels for example 0.618, 1.618, 2.618, 3.618 ...
3 - Make an assessment
This is the 4Hour chart for Ethereum and isn't as reliable as using a higher timeframe, say drawing the trendlines through the entire bear market on the weekly for Ethereum would be more effective. Regardless it still serves its purpose.
This is little data for the current bull run.
This trendline drawing can be applied to any (weekly preferable) chart and assessments can be made based on the position of the price, above or below a key Fib level E.g (0.618)
Hope this helps aspiring chartists

면책사항
해당 정보와 게시물은 금융, 투자, 트레이딩 또는 기타 유형의 조언이나 권장 사항으로 간주되지 않으며, 트레이딩뷰에서 제공하거나 보증하는 것이 아닙니다. 자세한 내용은 이용 약관을 참조하세요.
면책사항
해당 정보와 게시물은 금융, 투자, 트레이딩 또는 기타 유형의 조언이나 권장 사항으로 간주되지 않으며, 트레이딩뷰에서 제공하거나 보증하는 것이 아닙니다. 자세한 내용은 이용 약관을 참조하세요.