
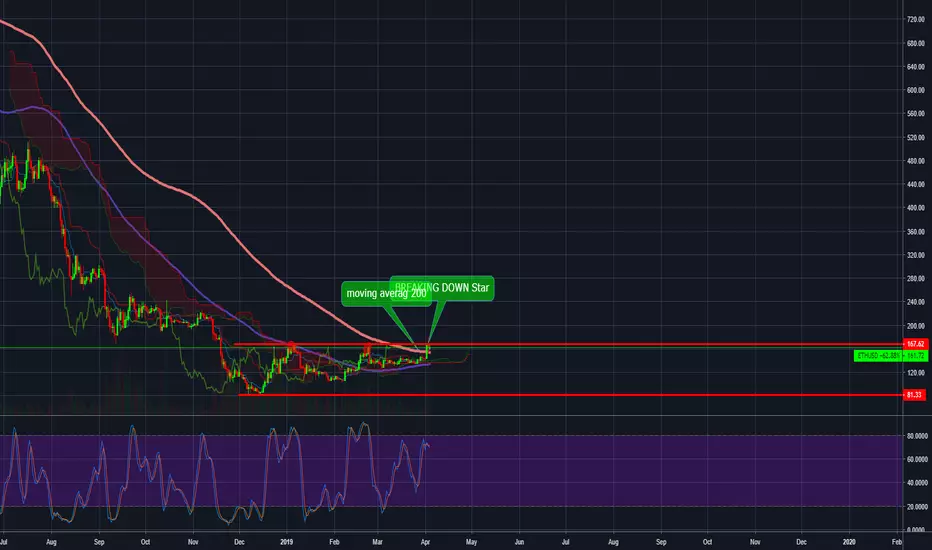
In this review, I would like to talk about some important things that can be seen in the Ethereum graph above.
Let's start from the beginning - I added 2 red lines that show solid support in the 81.33 area and resistance in the 167.60 area, that these words are written we are still within this range.
2 The red circles are located in two places where the Ethereum tried to break the resistance without success.
Yesterday we had another attempt to break the Ethereum price resistance that succeeded for a while and then became Star Candlestick, the definition of this candle is-"Small-bodied candles in the star position often suggest that market participants are becoming indecisive and that the strength of the current trend could be reversing" (according to Investopedia).
After analyzing all of the parameters mentioned above we recommend a sell signal as long as the Ether does not break the resistance.
Sell Ethereum:
Entry price: 161.30
Take profit: 102
Stop loss:180
Let's start from the beginning - I added 2 red lines that show solid support in the 81.33 area and resistance in the 167.60 area, that these words are written we are still within this range.
2 The red circles are located in two places where the Ethereum tried to break the resistance without success.
Yesterday we had another attempt to break the Ethereum price resistance that succeeded for a while and then became Star Candlestick, the definition of this candle is-"Small-bodied candles in the star position often suggest that market participants are becoming indecisive and that the strength of the current trend could be reversing" (according to Investopedia).
After analyzing all of the parameters mentioned above we recommend a sell signal as long as the Ether does not break the resistance.
Sell Ethereum:
Entry price: 161.30
Take profit: 102
Stop loss:180

면책사항
해당 정보와 게시물은 금융, 투자, 트레이딩 또는 기타 유형의 조언이나 권장 사항으로 간주되지 않으며, 트레이딩뷰에서 제공하거나 보증하는 것이 아닙니다. 자세한 내용은 이용 약관을 참조하세요.
면책사항
해당 정보와 게시물은 금융, 투자, 트레이딩 또는 기타 유형의 조언이나 권장 사항으로 간주되지 않으며, 트레이딩뷰에서 제공하거나 보증하는 것이 아닙니다. 자세한 내용은 이용 약관을 참조하세요.