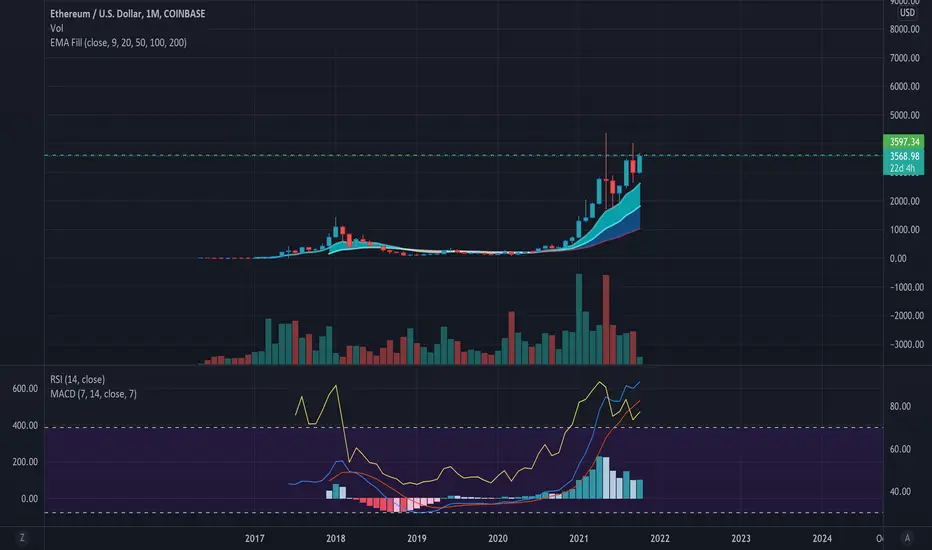
If you have a professional looking chart with plenty of fancy indicators, and yet nothing is making sense, you reached Analysis Paralysis; the rabbit hole that sucks everyone in by the gravity that every Indicator is important. In essence, they all are. The remedy to the mental confusion is to find the few that give you the best visual quality to make trading simpler. Strip the Charts back to its basics using only a handful of indicators.
The ETH chart provided uses MACD, RSI, Volume, and Script. The combination provides clear visualization of momentum, support & resistance zones and liquidity; key factors Traders need to create a trading strategy.
Majority of profitable Traders advocate the adage "Less is more!" I found this to be true in my experience.
The
ETH chart provided uses MACD, RSI, Volume, and Script. The combination provides clear visualization of momentum, support & resistance zones and liquidity; key factors Traders need to create a trading strategy. Majority of profitable Traders advocate the adage "Less is more!" I found this to be true in my experience.

면책사항
해당 정보와 게시물은 금융, 투자, 트레이딩 또는 기타 유형의 조언이나 권장 사항으로 간주되지 않으며, 트레이딩뷰에서 제공하거나 보증하는 것이 아닙니다. 자세한 내용은 이용 약관을 참조하세요.
면책사항
해당 정보와 게시물은 금융, 투자, 트레이딩 또는 기타 유형의 조언이나 권장 사항으로 간주되지 않으며, 트레이딩뷰에서 제공하거나 보증하는 것이 아닙니다. 자세한 내용은 이용 약관을 참조하세요.