
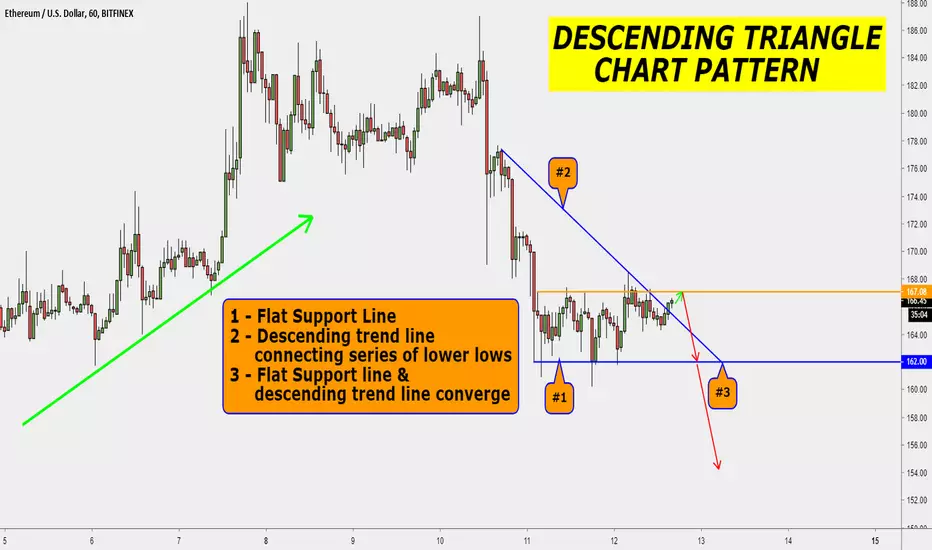
The descending triangle pattern is a continuation chart pattern that develops in the middle of a downtrend. However, in some instances this can play as a descending triangle reversal, also known as the bullish descending triangle pattern.
Note: The more a support level is tested the weaker it becomes.
Additionally, the breakout candle must also produce a close below the flat support level for a valid trade setup.
Note: The more a support level is tested the weaker it becomes.
Additionally, the breakout candle must also produce a close below the flat support level for a valid trade setup.

면책사항
해당 정보와 게시물은 금융, 투자, 트레이딩 또는 기타 유형의 조언이나 권장 사항으로 간주되지 않으며, 트레이딩뷰에서 제공하거나 보증하는 것이 아닙니다. 자세한 내용은 이용 약관을 참조하세요.
면책사항
해당 정보와 게시물은 금융, 투자, 트레이딩 또는 기타 유형의 조언이나 권장 사항으로 간주되지 않으며, 트레이딩뷰에서 제공하거나 보증하는 것이 아닙니다. 자세한 내용은 이용 약관을 참조하세요.