
Welcome back to Mubite’s Smart Money Concepts series.
We have covered Structure (BOS/CHoCH) and Entry Zones (Order Blocks). Now, we need to understand the Magnet that pulls price back to those zones.
That magnet is the Fair Value Gap (FVG), also known as Imbalance.
What Is a Fair Value Gap (FVG)?
A Fair Value Gap (FVG) is a technical pattern that highlights an imbalance in price action. In ICT (Inner Circle Trader) methodology, an FVG represents a point where the market fails to trade efficiently, leaving behind a “gap” that shows where buying or selling pressure was dominant.
Put simply, the FVG meaning is a price imbalance created when one side of the market moves so aggressively that the opposite side has little or no opportunity to respond. The FVG full form, Fair Value Gap, emphasizes that these gaps often mark prices where the market has not traded at its “fair value.”
The 3-Candle Formation of an FVG
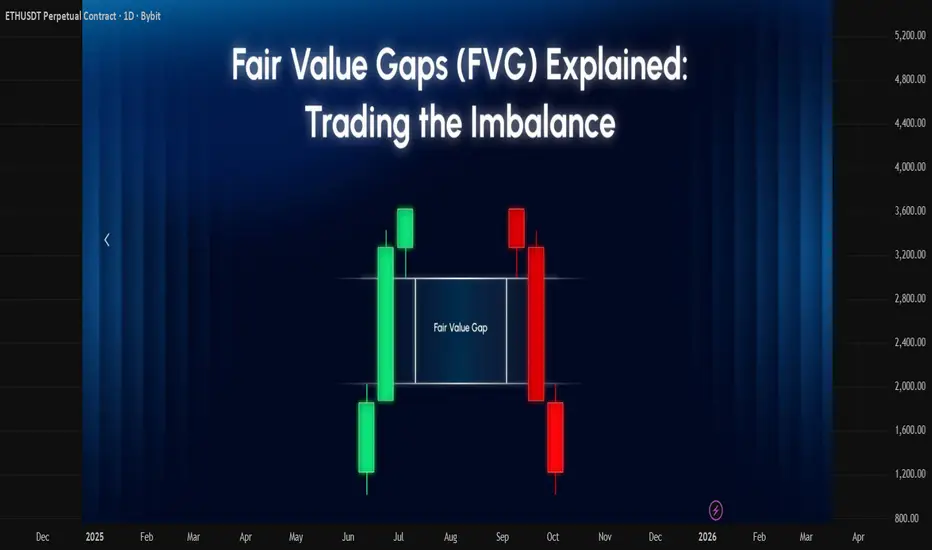
An FVG is typically identified through a three-candle formation:
Candle 1 (Impulsive Move Start): A strong candle forms in one direction (bullish candle or bearish candle), often fueled by heavy institutional orders.
Candle 2 (Continuation): The next candle continues strongly in the same direction, without revisiting the price levels left behind. This creates the imbalance.
Candle 3 (Confirmation): The final candle establishes the other side of the gap, leaving behind a “void” between Candle 1’s wick and Candle 3’s wick.
This gap is the “Fair Value Gap”, a price zone the market skipped over during the rapid move.
Why Do Institutional Traders Care About FVGs?
Institutional traders, such as banks and hedge funds, pay close attention to FVGs because they often act as magnets for price. Markets tend to revisit these imbalanced areas to “rebalance” liquidity.
By identifying FVGs, institutions can anticipate zones where price might retrace, creating opportunities for strategic entries or exits. In ICT concepts, these levels are seen as footprints of smart money, showing where large orders disrupted normal trading and where liquidity is likely to return.
How to Identify a Fair Value Gap (FVG) on a Chart
Traders often ask: how to identify a fair value gap? Below is a practical guide that combines both manual chart-reading and indicator-based methods.
FVG Step-by-Step Guide:
Spot the Initial Impulse Candle
Look for a strong bullish or bearish candle that shows a sudden shift in momentum. This usually reflects aggressive buying or selling pressure.
Check for the Three-Candle Pattern
A fair value gap example is best understood through the 3-candle structure:
Candle 1: A large impulse candle.
Candle 2: A continuation candle in the same direction, leaving untested price levels.
Candle 3: Forms without overlapping Candle 1’s wick, which creates the “gap.”
Locate the Gap Zone
The FVG is the area between the high of Candle 1’s wick and the low of Candle 3’s wick (in a bullish scenario), or the opposite in a bearish scenario. This untested space is the fair value gap.
Use Indicators for Confirmation
Some traders prefer to simplify the process with custom FVG indicators available on platforms like TradingView or MetaTrader. These tools automatically highlight imbalance zones, making it easier to scan multiple charts for FVG examples.
Confirm the Validity of the Gap
Not every gap qualifies as a fair value gap. To confirm a valid FVG:
Ensure that the three-candle structure is intact.
Check that price has not already retraced into and filled the gap.
Validate with volume or liquidity shifts, which often accompany institutional moves.
Watch for Market Reaction
Once identified, monitor how price behaves around the gap. If price retraces into the FVG and shows rejection, it strengthens the validity of the zone. If it fills completely, the FVG may no longer be tradable.
Common Mistakes to Avoid:
Confusing normal gaps with FVGs: Standard open-close gaps between sessions are not the same as ICT-style fair value gaps.
Ignoring candle wicks: Many beginners only compare candle bodies and miss the wick-to-wick imbalance.
Overlooking context: An FVG is more reliable when aligned with trend direction, liquidity levels, or higher-timeframe analysis.
Bullish vs Bearish FVG: Key Differences
Fair value gaps can be categorized based on their direction and market context.
Bearish Fair Value Gaps

A bearish Fair Value Gap indicator occurs when there is a gap between the lowest point of the wick on the first candlestick and the highest point of the wick on the third candlestick.
This gap typically forms within the body of the middle candlestick pattern.
What is crucial is that a gap has formed within the middle candlestick due to the lack of connection between the wicks of the first and third candlesticks, indicating potential downward pressure.
Bearish fair value gaps are caused by factors such as negative economic news, disappointing earnings reports, or sudden shifts in market sentiment toward pessimism.
How to Spot a Bearish FVG
Look for three consecutive candlesticks.
Identify the lowest wick of the first candlestick.
Identify the highest wick of the third candlestick.
If there is no overlap between these two wicks and the gap lies within the body of the second candle, a bearish FVG may be present.
Confirm with volume or additional bearish signals for higher accuracy.
Bullish Fair Value Gaps

A bullish Fair Value Gap indicator forms when there is a gap between the highest point of the wick on the first candlestick and the lowest point of the wick on the third candlestick.
Similar to the bearish FVG, the exact direction of each candlestick is not the main focus. What matters most is the presence of a gap within the middle candlestick where the wicks of the first and third candlesticks do not meet.
This gap signifies potential upward momentum and buying opportunities.
Bullish fair value gaps are typically triggered by positive economic news, better-than-expected earnings reports, or a sudden shift in investor sentiment towards optimism.
How to Spot a Bullish FVG
Observe three consecutive candlesticks.
Identify the highest wick of the first candlestick.
Identify the lowest wick of the third candlestick.
If the two wicks do not touch and the middle candle’s body contains the gap, this may indicate a bullish FVG.
Look for confirmation such as rising volume or bullish indicators before entering a trade.

part 2 next week
We have covered Structure (BOS/CHoCH) and Entry Zones (Order Blocks). Now, we need to understand the Magnet that pulls price back to those zones.
That magnet is the Fair Value Gap (FVG), also known as Imbalance.
What Is a Fair Value Gap (FVG)?
A Fair Value Gap (FVG) is a technical pattern that highlights an imbalance in price action. In ICT (Inner Circle Trader) methodology, an FVG represents a point where the market fails to trade efficiently, leaving behind a “gap” that shows where buying or selling pressure was dominant.
Put simply, the FVG meaning is a price imbalance created when one side of the market moves so aggressively that the opposite side has little or no opportunity to respond. The FVG full form, Fair Value Gap, emphasizes that these gaps often mark prices where the market has not traded at its “fair value.”
The 3-Candle Formation of an FVG
An FVG is typically identified through a three-candle formation:
Candle 1 (Impulsive Move Start): A strong candle forms in one direction (bullish candle or bearish candle), often fueled by heavy institutional orders.
Candle 2 (Continuation): The next candle continues strongly in the same direction, without revisiting the price levels left behind. This creates the imbalance.
Candle 3 (Confirmation): The final candle establishes the other side of the gap, leaving behind a “void” between Candle 1’s wick and Candle 3’s wick.
This gap is the “Fair Value Gap”, a price zone the market skipped over during the rapid move.
Why Do Institutional Traders Care About FVGs?
Institutional traders, such as banks and hedge funds, pay close attention to FVGs because they often act as magnets for price. Markets tend to revisit these imbalanced areas to “rebalance” liquidity.
By identifying FVGs, institutions can anticipate zones where price might retrace, creating opportunities for strategic entries or exits. In ICT concepts, these levels are seen as footprints of smart money, showing where large orders disrupted normal trading and where liquidity is likely to return.
How to Identify a Fair Value Gap (FVG) on a Chart
Traders often ask: how to identify a fair value gap? Below is a practical guide that combines both manual chart-reading and indicator-based methods.
FVG Step-by-Step Guide:
Spot the Initial Impulse Candle
Look for a strong bullish or bearish candle that shows a sudden shift in momentum. This usually reflects aggressive buying or selling pressure.
Check for the Three-Candle Pattern
A fair value gap example is best understood through the 3-candle structure:
Candle 1: A large impulse candle.
Candle 2: A continuation candle in the same direction, leaving untested price levels.
Candle 3: Forms without overlapping Candle 1’s wick, which creates the “gap.”
Locate the Gap Zone
The FVG is the area between the high of Candle 1’s wick and the low of Candle 3’s wick (in a bullish scenario), or the opposite in a bearish scenario. This untested space is the fair value gap.
Use Indicators for Confirmation
Some traders prefer to simplify the process with custom FVG indicators available on platforms like TradingView or MetaTrader. These tools automatically highlight imbalance zones, making it easier to scan multiple charts for FVG examples.
Confirm the Validity of the Gap
Not every gap qualifies as a fair value gap. To confirm a valid FVG:
Ensure that the three-candle structure is intact.
Check that price has not already retraced into and filled the gap.
Validate with volume or liquidity shifts, which often accompany institutional moves.
Watch for Market Reaction
Once identified, monitor how price behaves around the gap. If price retraces into the FVG and shows rejection, it strengthens the validity of the zone. If it fills completely, the FVG may no longer be tradable.
Common Mistakes to Avoid:
Confusing normal gaps with FVGs: Standard open-close gaps between sessions are not the same as ICT-style fair value gaps.
Ignoring candle wicks: Many beginners only compare candle bodies and miss the wick-to-wick imbalance.
Overlooking context: An FVG is more reliable when aligned with trend direction, liquidity levels, or higher-timeframe analysis.
Bullish vs Bearish FVG: Key Differences
Fair value gaps can be categorized based on their direction and market context.
Bearish Fair Value Gaps
A bearish Fair Value Gap indicator occurs when there is a gap between the lowest point of the wick on the first candlestick and the highest point of the wick on the third candlestick.
This gap typically forms within the body of the middle candlestick pattern.
What is crucial is that a gap has formed within the middle candlestick due to the lack of connection between the wicks of the first and third candlesticks, indicating potential downward pressure.
Bearish fair value gaps are caused by factors such as negative economic news, disappointing earnings reports, or sudden shifts in market sentiment toward pessimism.
How to Spot a Bearish FVG
Look for three consecutive candlesticks.
Identify the lowest wick of the first candlestick.
Identify the highest wick of the third candlestick.
If there is no overlap between these two wicks and the gap lies within the body of the second candle, a bearish FVG may be present.
Confirm with volume or additional bearish signals for higher accuracy.
Bullish Fair Value Gaps
A bullish Fair Value Gap indicator forms when there is a gap between the highest point of the wick on the first candlestick and the lowest point of the wick on the third candlestick.
Similar to the bearish FVG, the exact direction of each candlestick is not the main focus. What matters most is the presence of a gap within the middle candlestick where the wicks of the first and third candlesticks do not meet.
This gap signifies potential upward momentum and buying opportunities.
Bullish fair value gaps are typically triggered by positive economic news, better-than-expected earnings reports, or a sudden shift in investor sentiment towards optimism.
How to Spot a Bullish FVG
Observe three consecutive candlesticks.
Identify the highest wick of the first candlestick.
Identify the lowest wick of the third candlestick.
If the two wicks do not touch and the middle candle’s body contains the gap, this may indicate a bullish FVG.
Look for confirmation such as rising volume or bullish indicators before entering a trade.
part 2 next week

Mubite | Crypto Prop Firm
GET 30% OFF mubite.com/?discount=TW30
Discord: discord.gg/mubite
Twitter: x.com/mubite_com
Instagram: instagram.com/mubite_official
Youtube: youtube.com/@mubite_official
GET 30% OFF mubite.com/?discount=TW30
Discord: discord.gg/mubite
Twitter: x.com/mubite_com
Instagram: instagram.com/mubite_official
Youtube: youtube.com/@mubite_official
면책사항
해당 정보와 게시물은 금융, 투자, 트레이딩 또는 기타 유형의 조언이나 권장 사항으로 간주되지 않으며, 트레이딩뷰에서 제공하거나 보증하는 것이 아닙니다. 자세한 내용은 이용 약관을 참조하세요.
Mubite | Crypto Prop Firm
GET 30% OFF mubite.com/?discount=TW30
Discord: discord.gg/mubite
Twitter: x.com/mubite_com
Instagram: instagram.com/mubite_official
Youtube: youtube.com/@mubite_official
GET 30% OFF mubite.com/?discount=TW30
Discord: discord.gg/mubite
Twitter: x.com/mubite_com
Instagram: instagram.com/mubite_official
Youtube: youtube.com/@mubite_official
면책사항
해당 정보와 게시물은 금융, 투자, 트레이딩 또는 기타 유형의 조언이나 권장 사항으로 간주되지 않으며, 트레이딩뷰에서 제공하거나 보증하는 것이 아닙니다. 자세한 내용은 이용 약관을 참조하세요.