
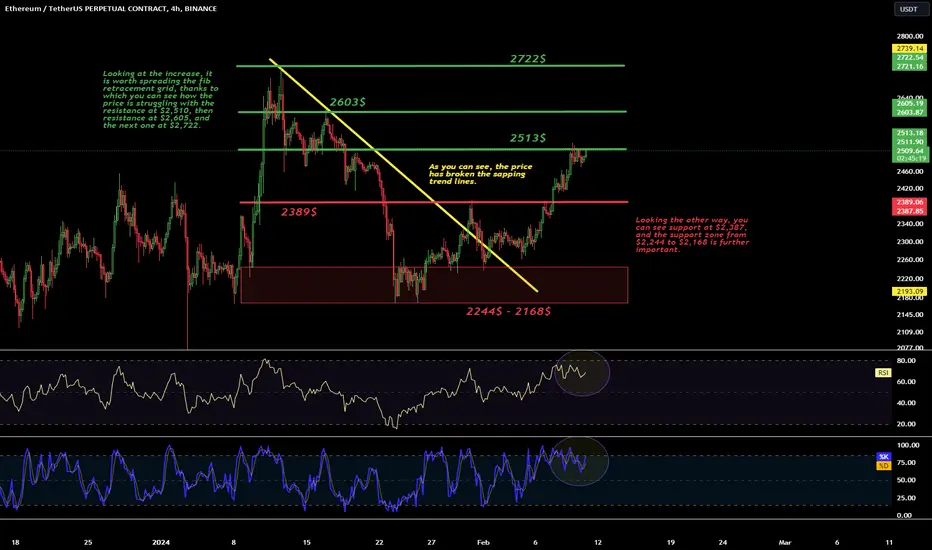
Hello everyone, let's take a look at the BTC to USDT chart on a four-hour time frame. As you can see, the price has broken the sapping trend lines.
Looking at the increase, it is worth spreading the fib retracement grid, thanks to which you can see how the price is struggling with the resistance at $2,510, then resistance at $2,605, and the next one at $2,722.
Looking the other way, you can see support at $2,387, and the support zone from $2,244 to $2,168 is further important.
The RSI indicator, similarly to the STOCH indicator, shows a movement towards the upper limit, which may lead to a desire to recover and a price drop.
Looking at the increase, it is worth spreading the fib retracement grid, thanks to which you can see how the price is struggling with the resistance at $2,510, then resistance at $2,605, and the next one at $2,722.
Looking the other way, you can see support at $2,387, and the support zone from $2,244 to $2,168 is further important.
The RSI indicator, similarly to the STOCH indicator, shows a movement towards the upper limit, which may lead to a desire to recover and a price drop.

면책사항
해당 정보와 게시물은 금융, 투자, 트레이딩 또는 기타 유형의 조언이나 권장 사항으로 간주되지 않으며, 트레이딩뷰에서 제공하거나 보증하는 것이 아닙니다. 자세한 내용은 이용 약관을 참조하세요.
면책사항
해당 정보와 게시물은 금융, 투자, 트레이딩 또는 기타 유형의 조언이나 권장 사항으로 간주되지 않으며, 트레이딩뷰에서 제공하거나 보증하는 것이 아닙니다. 자세한 내용은 이용 약관을 참조하세요.