
ETH technical analysis update
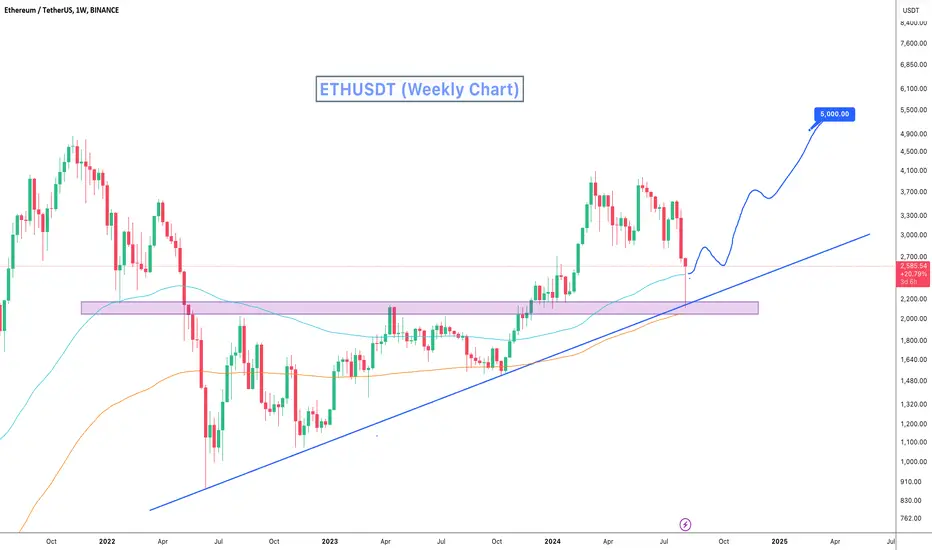
ETH's price touched the trend support line on the weekly chart and has bounced 20% from it. The price also touched the April resistance level at $2,150, which is now acting as strong support.
Price dropped below 30 RSI in day chart, this could indicate the bottom for ETH. The 100 and 200 EMA act as agood support for ETH in weekly chart. We can expect a significant bullish move from the current level, with the potential to reach a new all-time high in the coming months.
Regards
Hexa
ETH's price touched the trend support line on the weekly chart and has bounced 20% from it. The price also touched the April resistance level at $2,150, which is now acting as strong support.
Price dropped below 30 RSI in day chart, this could indicate the bottom for ETH. The 100 and 200 EMA act as agood support for ETH in weekly chart. We can expect a significant bullish move from the current level, with the potential to reach a new all-time high in the coming months.
Regards
Hexa


🚀Telegram : t.me/hexatrades
🌐Website: hexatrades.io/
🗣️Twitter(X): twitter.com/HexaTrades
🌐Website: hexatrades.io/
🗣️Twitter(X): twitter.com/HexaTrades
관련 발행물
면책사항
해당 정보와 게시물은 금융, 투자, 트레이딩 또는 기타 유형의 조언이나 권장 사항으로 간주되지 않으며, 트레이딩뷰에서 제공하거나 보증하는 것이 아닙니다. 자세한 내용은 이용 약관을 참조하세요.
🚀Telegram : t.me/hexatrades
🌐Website: hexatrades.io/
🗣️Twitter(X): twitter.com/HexaTrades
🌐Website: hexatrades.io/
🗣️Twitter(X): twitter.com/HexaTrades
관련 발행물
면책사항
해당 정보와 게시물은 금융, 투자, 트레이딩 또는 기타 유형의 조언이나 권장 사항으로 간주되지 않으며, 트레이딩뷰에서 제공하거나 보증하는 것이 아닙니다. 자세한 내용은 이용 약관을 참조하세요.