
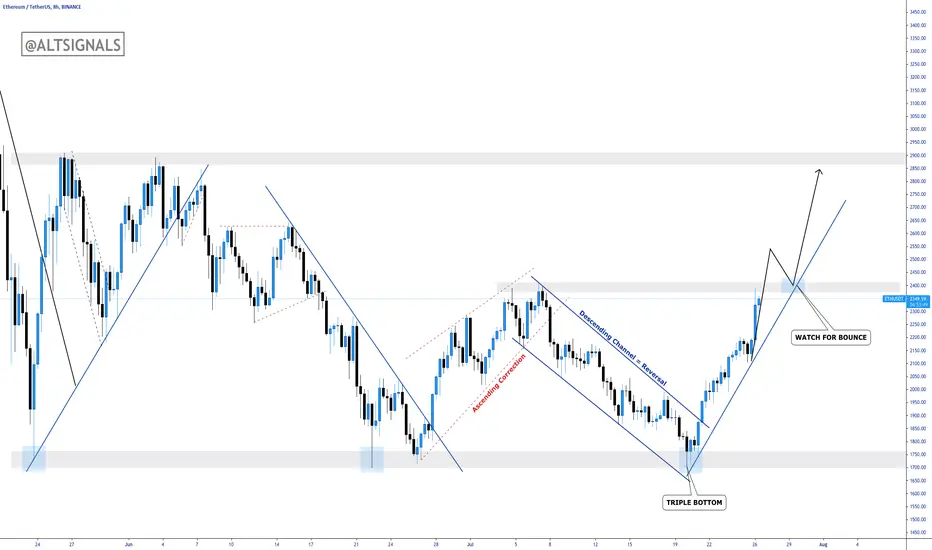
In our last Ethereum analysis, we were short from the break of ascending correction back to the bottom - raw gains of almost 25%!
We saw a triple bottom chart pattern which is a highly probable bearish to bullish reversal pattern. We are now approaching a very interesting level where we can look to add another buy position.
At the 2400 level, price converges with trendline and structure making it a high probability area to buy. Watch for price to clear the 2400 level and get in on the retest.
We saw a triple bottom chart pattern which is a highly probable bearish to bullish reversal pattern. We are now approaching a very interesting level where we can look to add another buy position.
At the 2400 level, price converges with trendline and structure making it a high probability area to buy. Watch for price to clear the 2400 level and get in on the retest.

🥃 Crypto Signals Since 2017 🥃
💎Telegram t.me/AltSignals 💎
📈 Signals/Algos altsignals.io/join 📈
💎Telegram t.me/AltSignals 💎
📈 Signals/Algos altsignals.io/join 📈
관련 발행물
면책사항
해당 정보와 게시물은 금융, 투자, 트레이딩 또는 기타 유형의 조언이나 권장 사항으로 간주되지 않으며, 트레이딩뷰에서 제공하거나 보증하는 것이 아닙니다. 자세한 내용은 이용 약관을 참조하세요.
🥃 Crypto Signals Since 2017 🥃
💎Telegram t.me/AltSignals 💎
📈 Signals/Algos altsignals.io/join 📈
💎Telegram t.me/AltSignals 💎
📈 Signals/Algos altsignals.io/join 📈
관련 발행물
면책사항
해당 정보와 게시물은 금융, 투자, 트레이딩 또는 기타 유형의 조언이나 권장 사항으로 간주되지 않으며, 트레이딩뷰에서 제공하거나 보증하는 것이 아닙니다. 자세한 내용은 이용 약관을 참조하세요.