
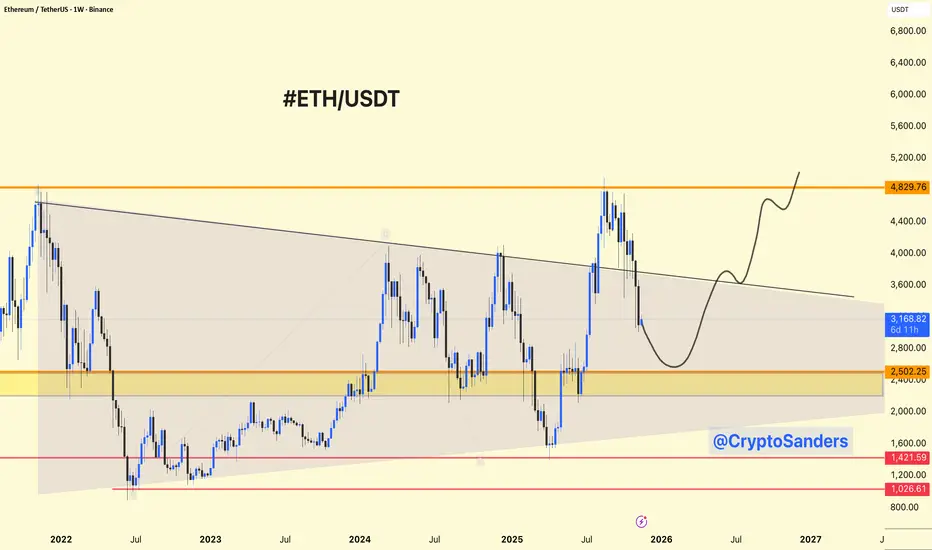
ETH is moving inside a long-term descending wedge/channel pattern, with the upper boundary acting as resistance and the lower as support.
Major Levels: Key horizontal levels include $2,502 (support) and $4,830 (major resistance). The wedge confines most price action since mid-2022.
Recent Action: ETH surged toward the wedge top near $4,830 but faced rejection, leading to the current pullback toward the wedge mid-zone and support. This retracement remains above trendline support and above the last key breakout region.
Bullish Path: If ETH rebounds from the wedge and horizontal support, a breakout above $3,600–$3,800 could re-test $4,830. On a breakout, long-term targets are $6,000+ based on the wedge height and prior cycle moves.
Bearish Risk: If the wedge support fails and ETH loses $2,500, further downside could be seen toward the $1,420–$1,030 area.
Cup & Handle/Accumulation: Multiple rounded bottoms and retests reflect long accumulation phases. A successful move above the wedge would complete this structure and suggest major upside.
ETH is consolidating within a large wedge structure, at support after a strong run and rejection near $4,830. Holding the $2,500–$2,800 zone is key for bullish continuation. A confirmed breakout can trigger a fresh multi-month rally, while a breakdown signals deeper retracement.
DYOR | NFA
Major Levels: Key horizontal levels include $2,502 (support) and $4,830 (major resistance). The wedge confines most price action since mid-2022.
Recent Action: ETH surged toward the wedge top near $4,830 but faced rejection, leading to the current pullback toward the wedge mid-zone and support. This retracement remains above trendline support and above the last key breakout region.
Bullish Path: If ETH rebounds from the wedge and horizontal support, a breakout above $3,600–$3,800 could re-test $4,830. On a breakout, long-term targets are $6,000+ based on the wedge height and prior cycle moves.
Bearish Risk: If the wedge support fails and ETH loses $2,500, further downside could be seen toward the $1,420–$1,030 area.
Cup & Handle/Accumulation: Multiple rounded bottoms and retests reflect long accumulation phases. A successful move above the wedge would complete this structure and suggest major upside.
ETH is consolidating within a large wedge structure, at support after a strong run and rejection near $4,830. Holding the $2,500–$2,800 zone is key for bullish continuation. A confirmed breakout can trigger a fresh multi-month rally, while a breakdown signals deeper retracement.
DYOR | NFA

관련 발행물
면책사항
해당 정보와 게시물은 금융, 투자, 트레이딩 또는 기타 유형의 조언이나 권장 사항으로 간주되지 않으며, 트레이딩뷰에서 제공하거나 보증하는 것이 아닙니다. 자세한 내용은 이용 약관을 참조하세요.
관련 발행물
면책사항
해당 정보와 게시물은 금융, 투자, 트레이딩 또는 기타 유형의 조언이나 권장 사항으로 간주되지 않으며, 트레이딩뷰에서 제공하거나 보증하는 것이 아닙니다. 자세한 내용은 이용 약관을 참조하세요.