
Hello Dear friends
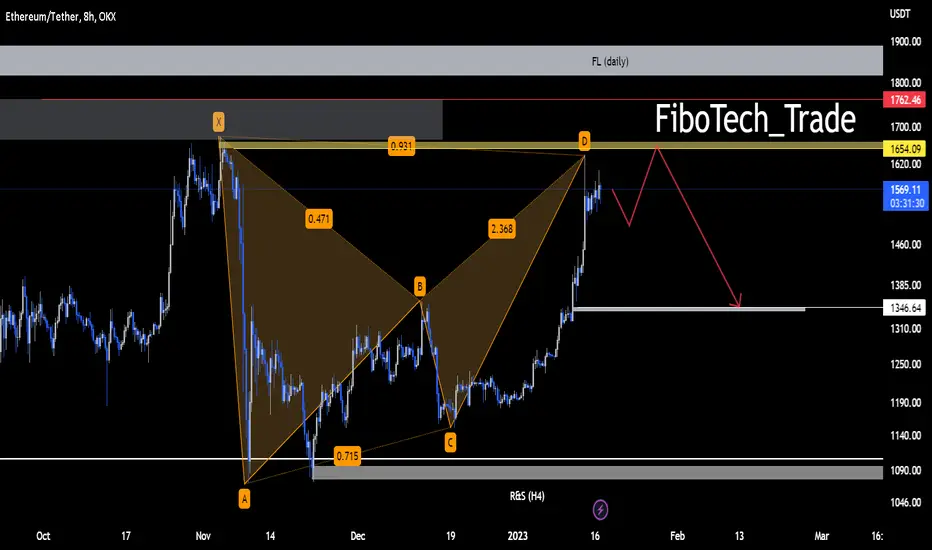
On the daily time frame, the idol pattern is associated with negative RSI divergence. The $1,654 resistance area is very important.
If the upward trend is above the price range of $1,762.46, the possibility of continuation to the area of $1,815 is strengthened. And the view of forming a downward trend will expire.
We would be happy to hear your comments
액티브 트레이드
It is possible that the $1,668 range will be fully consumed in the current upward trend.The condition for us to form a bearish trend is that the red support areas are consumed and the short-term uptrend line is broken downwards, until this, our mentality to form a bearish trend is just a view.
액티브 트레이드
액티브 트레이드
액티브 트레이드
So far, according to the analysis, a decreasing trend is being followed액티브 트레이드
The range we specified as the loss limit in the area of $1762 is still reserved and we still have the same view to continue the downward trend to the $1400 range.거래청산: 타겟 닿음
How fascinating the scenario was completed
면책사항
해당 정보와 게시물은 금융, 투자, 트레이딩 또는 기타 유형의 조언이나 권장 사항으로 간주되지 않으며, 트레이딩뷰에서 제공하거나 보증하는 것이 아닙니다. 자세한 내용은 이용 약관을 참조하세요.
면책사항
해당 정보와 게시물은 금융, 투자, 트레이딩 또는 기타 유형의 조언이나 권장 사항으로 간주되지 않으며, 트레이딩뷰에서 제공하거나 보증하는 것이 아닙니다. 자세한 내용은 이용 약관을 참조하세요.