
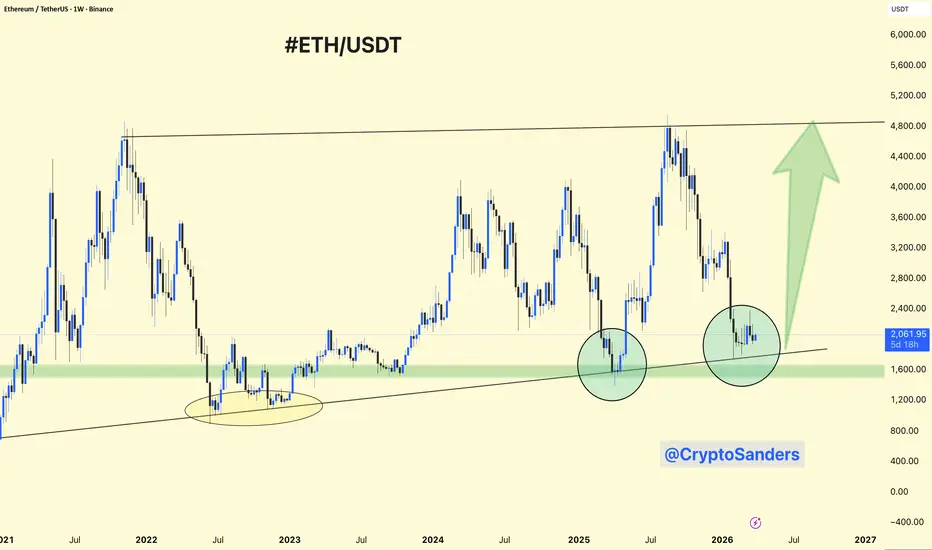
ETHUSDT weekly chart shows a massive multi‑year rising channel structure intact since the 2021 lows, with price now squeezing into the upper half after a prolonged consolidation phase.
The long‑term ascending channel has defined ETH’s macro uptrend, with the recent leg bouncing from the midline around $2,400–$2,500 and now testing the upper parallel near $4,200–$4,400.
Recent weekly candles have printed higher lows consistently, confirming buyers defending the channel base, while the green arrow projection targets a measured move to $5,000–$5,500 if the top breaks cleanly.
Bullish bias holds as long as price stays above the channel midline and $2,800 support; a weekly close above $4,400 would validate the breakout and open the full channel top toward $6k+.
Risk of a pullback exists if it rejects from the top again, but the structure favors continuation higher given the clean trendline respect over the years.
The long‑term ascending channel has defined ETH’s macro uptrend, with the recent leg bouncing from the midline around $2,400–$2,500 and now testing the upper parallel near $4,200–$4,400.
Recent weekly candles have printed higher lows consistently, confirming buyers defending the channel base, while the green arrow projection targets a measured move to $5,000–$5,500 if the top breaks cleanly.
Bullish bias holds as long as price stays above the channel midline and $2,800 support; a weekly close above $4,400 would validate the breakout and open the full channel top toward $6k+.
Risk of a pullback exists if it rejects from the top again, but the structure favors continuation higher given the clean trendline respect over the years.

관련 발행물
면책사항
해당 정보와 게시물은 금융, 투자, 트레이딩 또는 기타 유형의 조언이나 권장 사항으로 간주되지 않으며, 트레이딩뷰에서 제공하거나 보증하는 것이 아닙니다. 자세한 내용은 이용 약관을 참조하세요.
관련 발행물
면책사항
해당 정보와 게시물은 금융, 투자, 트레이딩 또는 기타 유형의 조언이나 권장 사항으로 간주되지 않으며, 트레이딩뷰에서 제공하거나 보증하는 것이 아닙니다. 자세한 내용은 이용 약관을 참조하세요.