
Hey traders,
In this educational post, I want to discuss with you one of the most accurate REVERSAL candlestick patterns - the engulfing candle.
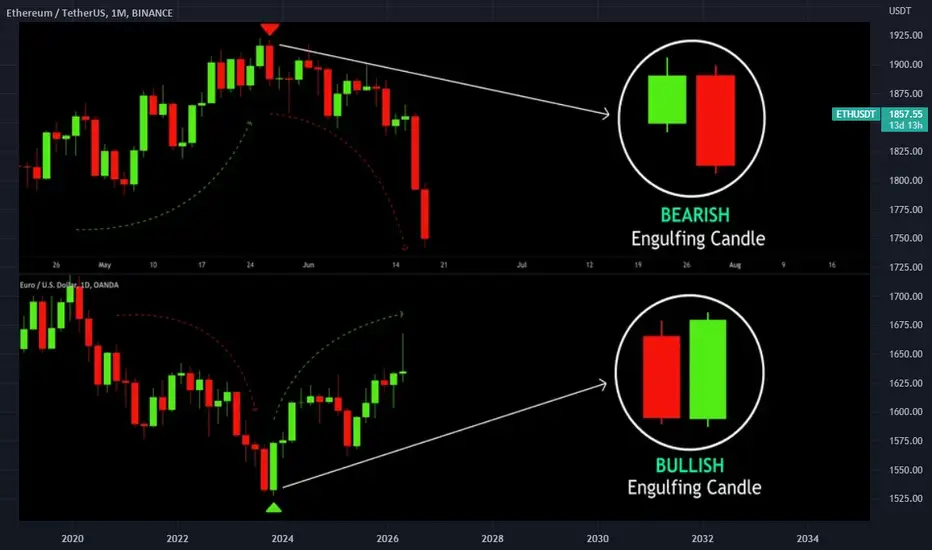
On ETHUSD chart, I spotted for you bullish & bearish examples of this pattern.
The logic behind this pattern is quite simple:
⭐️In a bullish trend, after a strong directional movement, the price reaches some important structure level. Growing steadily and forming a sequence of green bullish candles the price suddenly forms a strong bearish candle.
What is particular about that candle is the fact that its total range (distance from the wick high to wick low) & body range (distance from body open to body close) exceed the ranges of a previous bullish candle.
🔻Such a candle we will call a bearish engulfing candle.
Most of the time it signifies a strong spike in selling volumes and willingness of sellers to push.
With a high probability, such a formation leads to a pullback or even a trend reversal.

면책사항
해당 정보와 게시물은 금융, 투자, 트레이딩 또는 기타 유형의 조언이나 권장 사항으로 간주되지 않으며, 트레이딩뷰에서 제공하거나 보증하는 것이 아닙니다. 자세한 내용은 이용 약관을 참조하세요.
면책사항
해당 정보와 게시물은 금융, 투자, 트레이딩 또는 기타 유형의 조언이나 권장 사항으로 간주되지 않으며, 트레이딩뷰에서 제공하거나 보증하는 것이 아닙니다. 자세한 내용은 이용 약관을 참조하세요.