
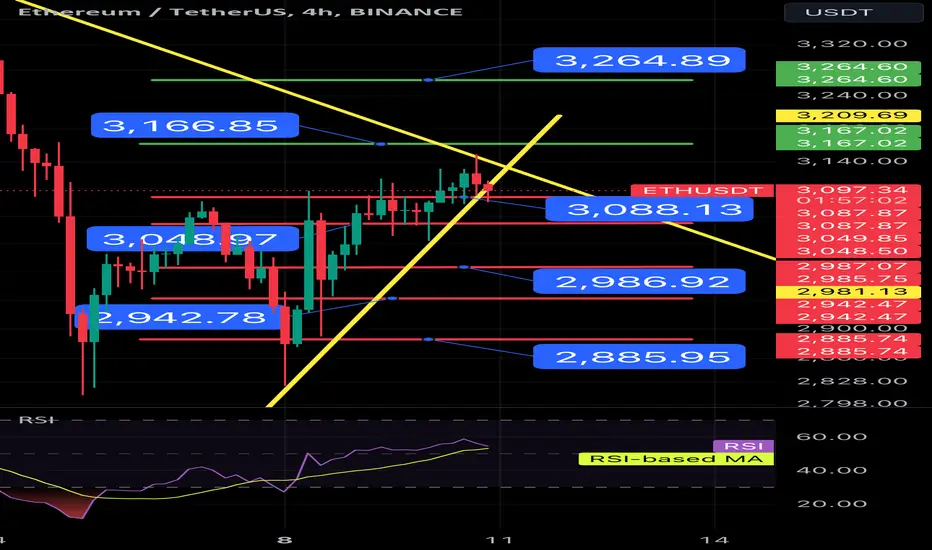
Hello everyone, I invite you to a quick review of the ETH to USDT chart for the 4H period. As we can see, the price is approaching leaving the local triangle, which indicates a possible direction for further movement.
When the price starts to reverse, support levels are visible at $3,088, then support levels are visible at $3,048, and support levels are at $2,986, $2,942, and $2,885.
However, when the price moves up again, it must overcome the resistance at $3,166 to continue towards the strong resistance at $3,264.
Looking at the RSI indicator, we can see that we have entered the upper part of the range, but there is still room for the price to go up.
When the price starts to reverse, support levels are visible at $3,088, then support levels are visible at $3,048, and support levels are at $2,986, $2,942, and $2,885.
However, when the price moves up again, it must overcome the resistance at $3,166 to continue towards the strong resistance at $3,264.
Looking at the RSI indicator, we can see that we have entered the upper part of the range, but there is still room for the price to go up.

면책사항
해당 정보와 게시물은 금융, 투자, 트레이딩 또는 기타 유형의 조언이나 권장 사항으로 간주되지 않으며, 트레이딩뷰에서 제공하거나 보증하는 것이 아닙니다. 자세한 내용은 이용 약관을 참조하세요.
면책사항
해당 정보와 게시물은 금융, 투자, 트레이딩 또는 기타 유형의 조언이나 권장 사항으로 간주되지 않으며, 트레이딩뷰에서 제공하거나 보증하는 것이 아닙니다. 자세한 내용은 이용 약관을 참조하세요.