
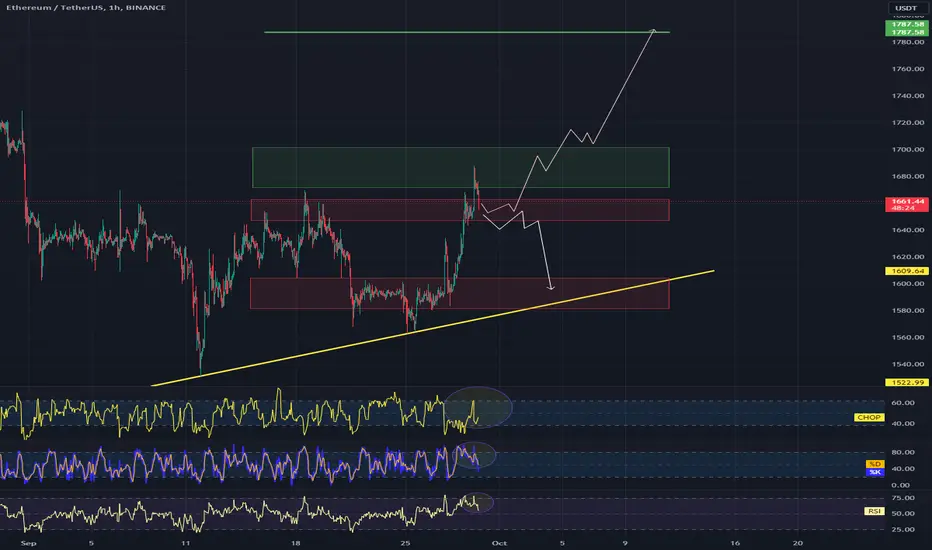
Hello everyone, let's take a look at the ETH to USDT chart on a one hour time frame. As you can see, the price is moving above the local uptrend line.
After unfolding the trend based fib extension grid, we see that a support zone has formed from $1,663 to $1,647, and then we have a second zone from $1,604 to $1,581.
Looking the other way, we can see that the price is fighting against a strong resistance zone from $1,671 to $1,701, only when the top comes out of it can we see an attempt to grow towards the resistance at $1,787.
Looking at the CHOP indicator, we see that the collected energy was again used to increase the price, while the STOCH and RSI indicators confirm that the recovery creates room for a greater price increase.
After unfolding the trend based fib extension grid, we see that a support zone has formed from $1,663 to $1,647, and then we have a second zone from $1,604 to $1,581.
Looking the other way, we can see that the price is fighting against a strong resistance zone from $1,671 to $1,701, only when the top comes out of it can we see an attempt to grow towards the resistance at $1,787.
Looking at the CHOP indicator, we see that the collected energy was again used to increase the price, while the STOCH and RSI indicators confirm that the recovery creates room for a greater price increase.

면책사항
해당 정보와 게시물은 금융, 투자, 트레이딩 또는 기타 유형의 조언이나 권장 사항으로 간주되지 않으며, 트레이딩뷰에서 제공하거나 보증하는 것이 아닙니다. 자세한 내용은 이용 약관을 참조하세요.
면책사항
해당 정보와 게시물은 금융, 투자, 트레이딩 또는 기타 유형의 조언이나 권장 사항으로 간주되지 않으며, 트레이딩뷰에서 제공하거나 보증하는 것이 아닙니다. 자세한 내용은 이용 약관을 참조하세요.