
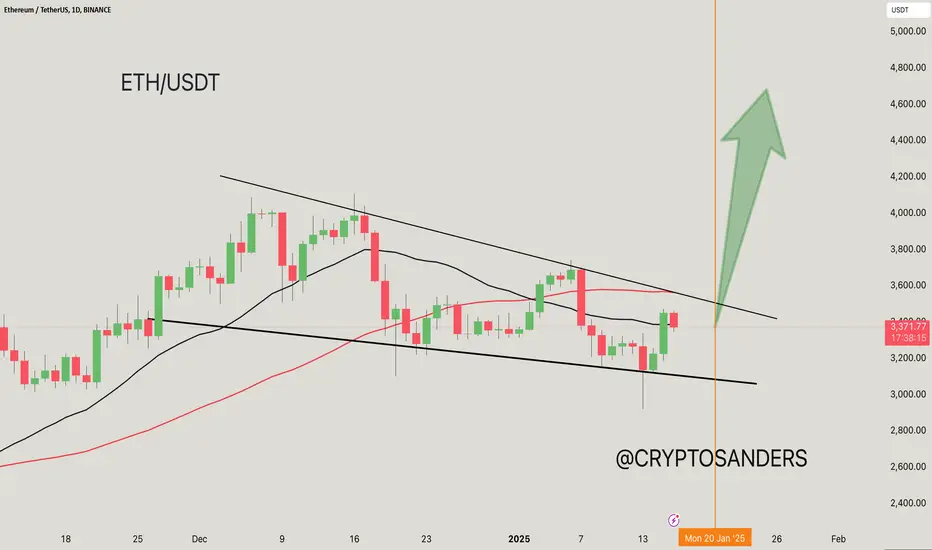
Descending Triangle Formation: ETH is consolidating within the descending triangle pattern. The downward-sloping trendline represents resistance, while the flat support at the base provides a crucial level to watch.
Current Price: Trading at $3,368.63, ETH is near the lower boundary of the triangle.
$3,400 – $3,450: Immediate resistance area. A breakout above the descending trendline would indicate bullish momentum.
$3,800 – $4,000: A breakout confirmation target range.
$3,200 – $3,250: Crucial support area. A breakdown below this level could invalidate bullish scenarios and lead to further declines.
21 EMA (black): $3,387 – Providing short-term resistance.
50 EMA (red): $3,562 – Acting as dynamic resistance, a breakout above this would signal renewed bullish momentum.
ETH moving above $3,450 (descending trendline) could lead to a rally towards $4,000 – $4,400 with significant volume.
The green arrow shows this potential uptrend.
Let me know if you’d like further assistance or adjustments!
DYOR. NFA
Current Price: Trading at $3,368.63, ETH is near the lower boundary of the triangle.
$3,400 – $3,450: Immediate resistance area. A breakout above the descending trendline would indicate bullish momentum.
$3,800 – $4,000: A breakout confirmation target range.
$3,200 – $3,250: Crucial support area. A breakdown below this level could invalidate bullish scenarios and lead to further declines.
21 EMA (black): $3,387 – Providing short-term resistance.
50 EMA (red): $3,562 – Acting as dynamic resistance, a breakout above this would signal renewed bullish momentum.
ETH moving above $3,450 (descending trendline) could lead to a rally towards $4,000 – $4,400 with significant volume.
The green arrow shows this potential uptrend.
Let me know if you’d like further assistance or adjustments!
DYOR. NFA

관련 발행물
면책사항
해당 정보와 게시물은 금융, 투자, 트레이딩 또는 기타 유형의 조언이나 권장 사항으로 간주되지 않으며, 트레이딩뷰에서 제공하거나 보증하는 것이 아닙니다. 자세한 내용은 이용 약관을 참조하세요.
관련 발행물
면책사항
해당 정보와 게시물은 금융, 투자, 트레이딩 또는 기타 유형의 조언이나 권장 사항으로 간주되지 않으며, 트레이딩뷰에서 제공하거나 보증하는 것이 아닙니다. 자세한 내용은 이용 약관을 참조하세요.