Short
ETP/USD DAILY CHART bearish signals
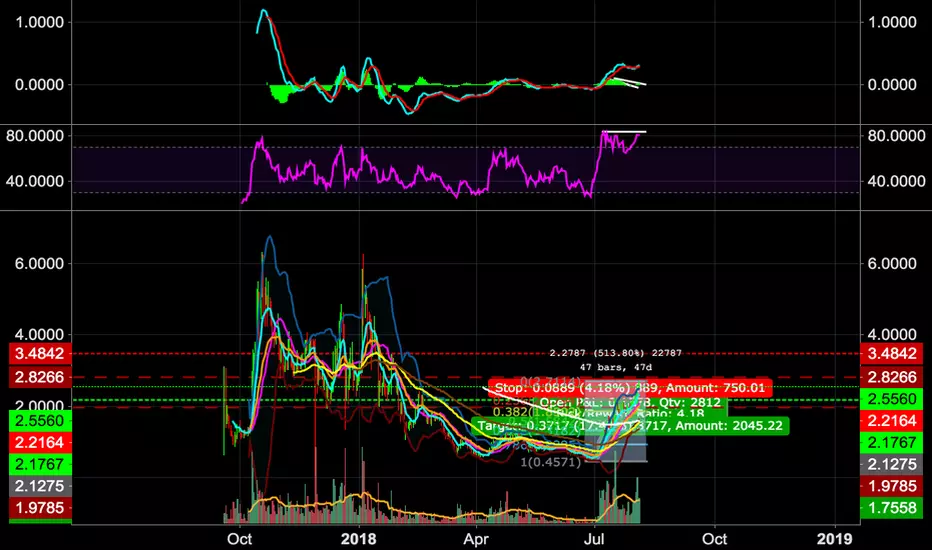
after an increase in price of more than 513% in 41 days with high volume ETP is most likely to retrace very soon.
MACD is really high and forms bearish divergences in the histogram. In addition RSI is performing bearish divergences too and is in the overbought zone for quite a long time.
Strong bearish signals. Daily chart. Nevertheless I see a possible rise to 2.833 USD before the retracement starts as the is the 6.18 fib level.
MACD is really high and forms bearish divergences in the histogram. In addition RSI is performing bearish divergences too and is in the overbought zone for quite a long time.
Strong bearish signals. Daily chart. Nevertheless I see a possible rise to 2.833 USD before the retracement starts as the is the 6.18 fib level.
노트
as there is the 6.18 fib level.*
면책사항
해당 정보와 게시물은 금융, 투자, 트레이딩 또는 기타 유형의 조언이나 권장 사항으로 간주되지 않으며, 트레이딩뷰에서 제공하거나 보증하는 것이 아닙니다. 자세한 내용은 이용 약관을 참조하세요.
면책사항
해당 정보와 게시물은 금융, 투자, 트레이딩 또는 기타 유형의 조언이나 권장 사항으로 간주되지 않으며, 트레이딩뷰에서 제공하거나 보증하는 것이 아닙니다. 자세한 내용은 이용 약관을 참조하세요.