

Hello Fellow Traders!
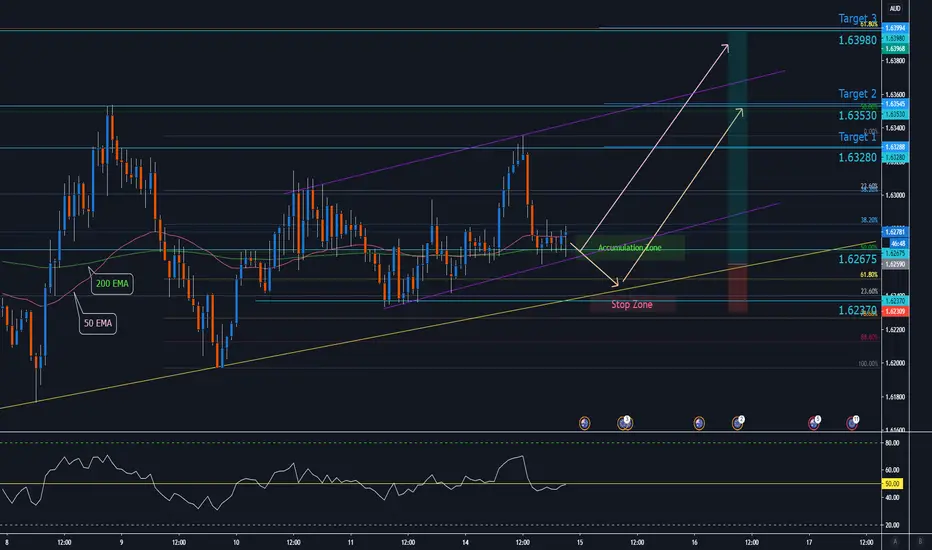
Trend line set back in August through September intact and respected.
Indicator and signals clustering pointing to upside before any major falls.
Key Points:
- Price holding above the 200 EMA
- Price holding above the 50 EMA
- Price sitting on 200 EMA clusters with 50% Fibonacci as support
- RSI approaching 50 mid-point and has room to cross above.
- Holding above trend line we can use as reference for exits
- A bounce off trend line would cluster with 61.8% Fibonacci
- Target 3 is the 61.8% retracement of August High to September Low
Key Levels:
Support – 200 EMA, 50 EMA, 1.62675, 1.62370
Resistance – 1.63280, 1.63530, 1.63980
Entry Zone:
Optimal entry provides the greatest reward to risk ratio while supporting entry is a zone for reversal signals.
Optimal Entry – 1.62590
Supporting Entry – 1.62680
Candle Reversals for entry
- Bullish Hammer
- Bullish Engulfing
- Bullish Piercing
The Risk:
As traders, it is your job to mitigate the risk and only trade structures that provide high probability and great reward to risk ratios.
If you are not comfortable with defined exit levels, experiment with Moving Averages to help set solid exit rules to protect your capital.
IF: Price breaks below 1.62309 and violates the trend line – this would suggest the structure is not in our favour and would be wise to reduce exposure or close the trade until a solid signal gives us reasons to re-enter.
Reward / Reward Targets:
Optimal Entry 1.62590 – Target 1 1.63280 = 2.5x Reward to Risk
Optimal Entry 1.62590 – Target 2 1.63530 = 3.5x Reward to Risk
Optimal Entry 1.62590 – Target 3 1.63980 = 5x Reward to Risk
Supporting Entry 1.62680 – Target 1 1.63280 = 1.65x Reward to Risk
Supporting Entry 1.62680 – Target 2 1.63280 = 2.2x Reward to Risk
Supporting Entry 1.62680 – Target 3 1.63280 = 3.5x Reward to Risk
Trend line set back in August through September intact and respected.
Indicator and signals clustering pointing to upside before any major falls.
Key Points:
- Price holding above the 200 EMA
- Price holding above the 50 EMA
- Price sitting on 200 EMA clusters with 50% Fibonacci as support
- RSI approaching 50 mid-point and has room to cross above.
- Holding above trend line we can use as reference for exits
- A bounce off trend line would cluster with 61.8% Fibonacci
- Target 3 is the 61.8% retracement of August High to September Low
Key Levels:
Support – 200 EMA, 50 EMA, 1.62675, 1.62370
Resistance – 1.63280, 1.63530, 1.63980
Entry Zone:
Optimal entry provides the greatest reward to risk ratio while supporting entry is a zone for reversal signals.
Optimal Entry – 1.62590
Supporting Entry – 1.62680
Candle Reversals for entry
- Bullish Hammer
- Bullish Engulfing
- Bullish Piercing
The Risk:
As traders, it is your job to mitigate the risk and only trade structures that provide high probability and great reward to risk ratios.
If you are not comfortable with defined exit levels, experiment with Moving Averages to help set solid exit rules to protect your capital.
IF: Price breaks below 1.62309 and violates the trend line – this would suggest the structure is not in our favour and would be wise to reduce exposure or close the trade until a solid signal gives us reasons to re-enter.
Reward / Reward Targets:
Optimal Entry 1.62590 – Target 1 1.63280 = 2.5x Reward to Risk
Optimal Entry 1.62590 – Target 2 1.63530 = 3.5x Reward to Risk
Optimal Entry 1.62590 – Target 3 1.63980 = 5x Reward to Risk
Supporting Entry 1.62680 – Target 1 1.63280 = 1.65x Reward to Risk
Supporting Entry 1.62680 – Target 2 1.63280 = 2.2x Reward to Risk
Supporting Entry 1.62680 – Target 3 1.63280 = 3.5x Reward to Risk

👉 Discord: @tradetheday discord.gg/3xF8xs4RRW
👉 Facebook: @tradetheday facebook.com/tradetheday
👉 Instagram: tradethedayfx instagram.com/tradethedayfx
👉 Telegram: t.me/tradetheday
👉 Facebook: @tradetheday facebook.com/tradetheday
👉 Instagram: tradethedayfx instagram.com/tradethedayfx
👉 Telegram: t.me/tradetheday
면책사항
해당 정보와 게시물은 금융, 투자, 트레이딩 또는 기타 유형의 조언이나 권장 사항으로 간주되지 않으며, 트레이딩뷰에서 제공하거나 보증하는 것이 아닙니다. 자세한 내용은 이용 약관을 참조하세요.
👉 Discord: @tradetheday discord.gg/3xF8xs4RRW
👉 Facebook: @tradetheday facebook.com/tradetheday
👉 Instagram: tradethedayfx instagram.com/tradethedayfx
👉 Telegram: t.me/tradetheday
👉 Facebook: @tradetheday facebook.com/tradetheday
👉 Instagram: tradethedayfx instagram.com/tradethedayfx
👉 Telegram: t.me/tradetheday
면책사항
해당 정보와 게시물은 금융, 투자, 트레이딩 또는 기타 유형의 조언이나 권장 사항으로 간주되지 않으며, 트레이딩뷰에서 제공하거나 보증하는 것이 아닙니다. 자세한 내용은 이용 약관을 참조하세요.