

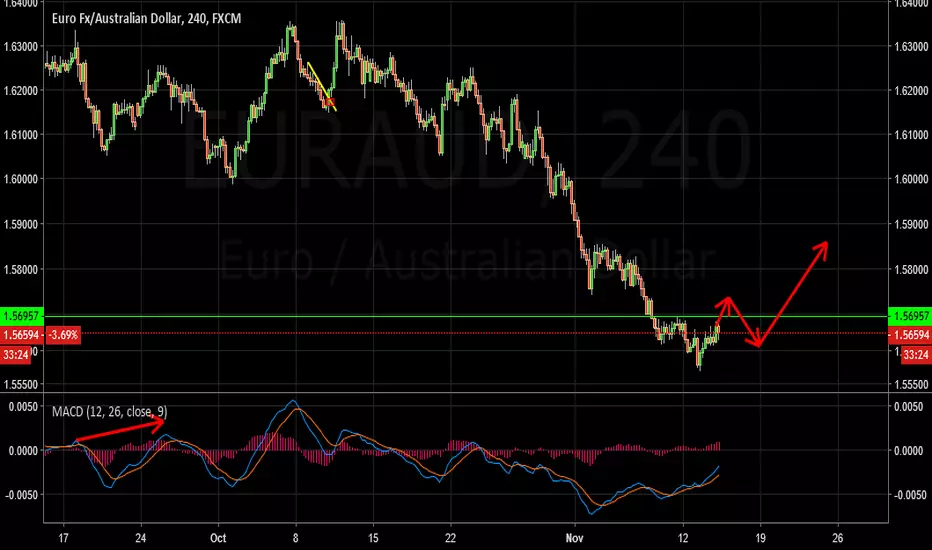
D1 - Bearish convergence. As per the book scenario we may now expect a pullback to happen.
We may now look for evidences of bullish pressure on lower timeframes in order to trade this pullback.
H4 - Two bullish divergences in a row.
If the price moves higher and breaks above the high (marked in green line), we may then look for pullbacks to happen with bullish hidden divergence to form (either on the H4 chart or on the H1 chart).
We may then look for buys with more bullish evidences. We may look for buys until we get any opposite signs.
We may now look for evidences of bullish pressure on lower timeframes in order to trade this pullback.
H4 - Two bullish divergences in a row.
If the price moves higher and breaks above the high (marked in green line), we may then look for pullbacks to happen with bullish hidden divergence to form (either on the H4 chart or on the H1 chart).
We may then look for buys with more bullish evidences. We may look for buys until we get any opposite signs.
노트
H4 - Price couldn't break the high we were looking for, instead it pushed lower for new low. Second possible divergence is now forming which gives the opportunity to look for aggressive buys upon completion of false break and the divergence.
면책사항
해당 정보와 게시물은 금융, 투자, 트레이딩 또는 기타 유형의 조언이나 권장 사항으로 간주되지 않으며, 트레이딩뷰에서 제공하거나 보증하는 것이 아닙니다. 자세한 내용은 이용 약관을 참조하세요.
면책사항
해당 정보와 게시물은 금융, 투자, 트레이딩 또는 기타 유형의 조언이나 권장 사항으로 간주되지 않으며, 트레이딩뷰에서 제공하거나 보증하는 것이 아닙니다. 자세한 내용은 이용 약관을 참조하세요.