

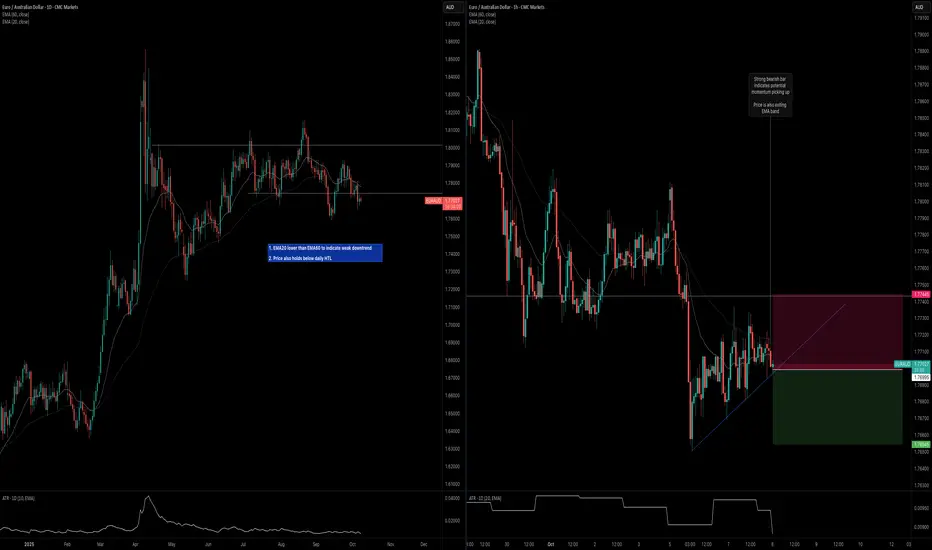
Key Observations
Daily Timeframe
H1 Timeframe
Daily Timeframe
- EMA20 is slightly lower than EMA60 and price is below both to indicate weak downtrend
- However, price is also holding below a daily HTL so buying pressure also remains weak or non-existent
H1 Timeframe
- Price is exiting away from the EMA band and below both EMA20 and EMA60 to indicate high probability of downside momentum
- If price crosses below the ATL, that's a further indication of downside momentum

면책사항
해당 정보와 게시물은 금융, 투자, 트레이딩 또는 기타 유형의 조언이나 권장 사항으로 간주되지 않으며, 트레이딩뷰에서 제공하거나 보증하는 것이 아닙니다. 자세한 내용은 이용 약관을 참조하세요.
면책사항
해당 정보와 게시물은 금융, 투자, 트레이딩 또는 기타 유형의 조언이나 권장 사항으로 간주되지 않으며, 트레이딩뷰에서 제공하거나 보증하는 것이 아닙니다. 자세한 내용은 이용 약관을 참조하세요.