

Hi Traders
EUR/CAD Multi-Timeframe analysis
H1 CHART ( BEARISH )
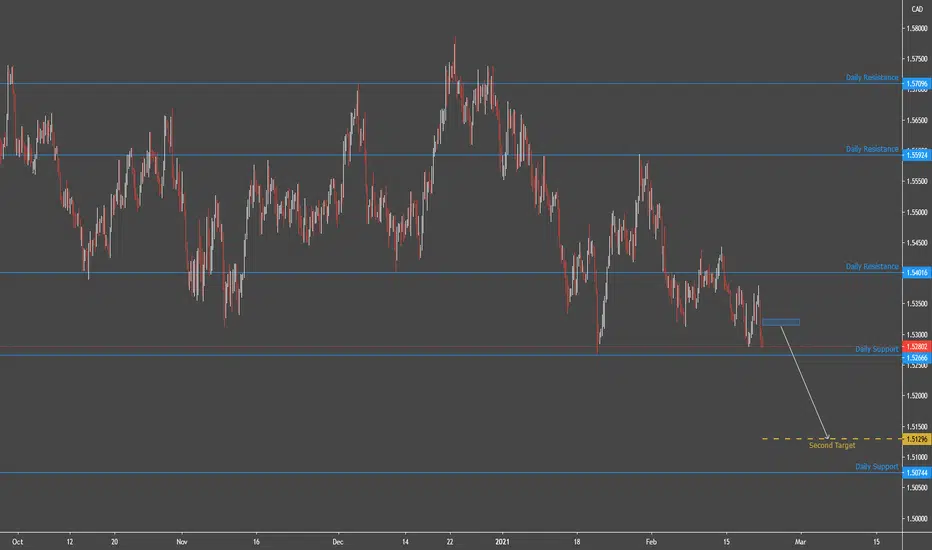
Waiting for a retracement higher towards the 1.53175 resistance level in order to reinstate SHORT positions. Next important resistance is the 1.53780 level.
Support & Resistances
1.52790 1.53175
1.52213 1.53780
1.51227 1.54766
H4 CHART ( BEARISH )
A medium high probability, entry signal to go SHORT was given at 1.53151 after the market found resistance at 1.53804 . Only the upward break of 1.53804 would cancel the bearish scenario.
Support & Resistances
1.53120 1.53782
1.52821 1.54414
1.52255 1.54980
DAILY CHART ( NEUTRAL )
The market is dominated by uncertainty. The occasionally prevailing trend lasts for a limited time and changes its direction too frequently. As long as the market remains unstable, we stay aside, waiting for the market to get back on track.
Support & Resistances
1.52666 1.54016
1.50744 1.55924
1.47486 1.57096
WEEKLY CHART ( NEUTRAL )
The market is dominated by uncertainty. The occasionally prevailing trend lasts for a limited time and changes its direction too frequently. As long as the market remains unstable, we stay aside, waiting for the market to get back on track.
Support & Resistances
1.52666 1.59912
1.50518 1.62060
1.47707 1.64871

GET MY FREE EDUCATION HERE:
bit.ly/3pQudRX
bit.ly/3pQudRX
면책사항
해당 정보와 게시물은 금융, 투자, 트레이딩 또는 기타 유형의 조언이나 권장 사항으로 간주되지 않으며, 트레이딩뷰에서 제공하거나 보증하는 것이 아닙니다. 자세한 내용은 이용 약관을 참조하세요.
GET MY FREE EDUCATION HERE:
bit.ly/3pQudRX
bit.ly/3pQudRX
면책사항
해당 정보와 게시물은 금융, 투자, 트레이딩 또는 기타 유형의 조언이나 권장 사항으로 간주되지 않으며, 트레이딩뷰에서 제공하거나 보증하는 것이 아닙니다. 자세한 내용은 이용 약관을 참조하세요.