

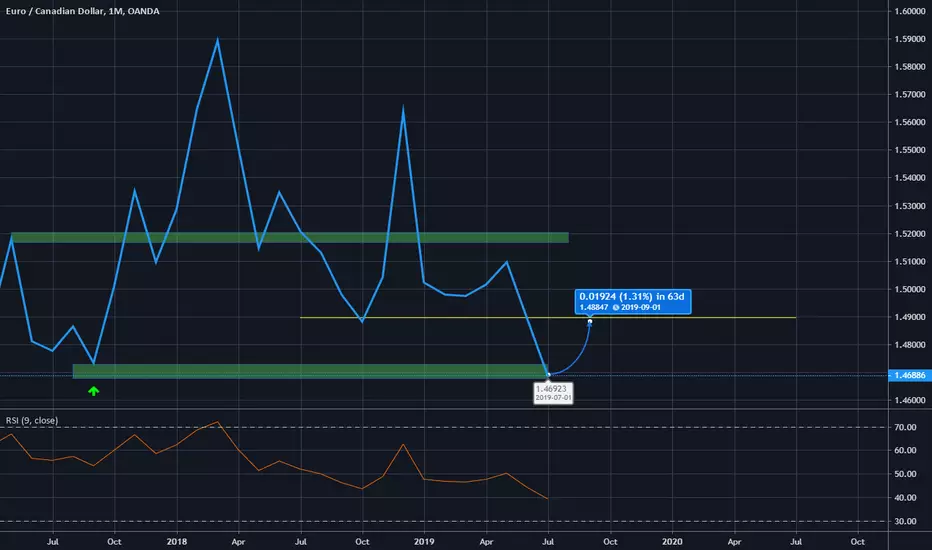
The Support Level is hard to see on the daily and even weekly chart, but it does exist! This is a monthly support level!
so.....
1. Daily Chart Came Down To Monthly Support and moved up , and then CAME DOWN again and RETESTED the Montly Support Area!
2. Indicators on hour 4 indicate a buy now!
So the Idea is that we are have entered a buy on the daily chart at a monthly support area and we ENTERED our trade on hour 4 to confirm this buy!
I hope this helps!
so.....
1. Daily Chart Came Down To Monthly Support and moved up , and then CAME DOWN again and RETESTED the Montly Support Area!
2. Indicators on hour 4 indicate a buy now!
So the Idea is that we are have entered a buy on the daily chart at a monthly support area and we ENTERED our trade on hour 4 to confirm this buy!
I hope this helps!

면책사항
해당 정보와 게시물은 금융, 투자, 트레이딩 또는 기타 유형의 조언이나 권장 사항으로 간주되지 않으며, 트레이딩뷰에서 제공하거나 보증하는 것이 아닙니다. 자세한 내용은 이용 약관을 참조하세요.
면책사항
해당 정보와 게시물은 금융, 투자, 트레이딩 또는 기타 유형의 조언이나 권장 사항으로 간주되지 않으며, 트레이딩뷰에서 제공하거나 보증하는 것이 아닙니다. 자세한 내용은 이용 약관을 참조하세요.