

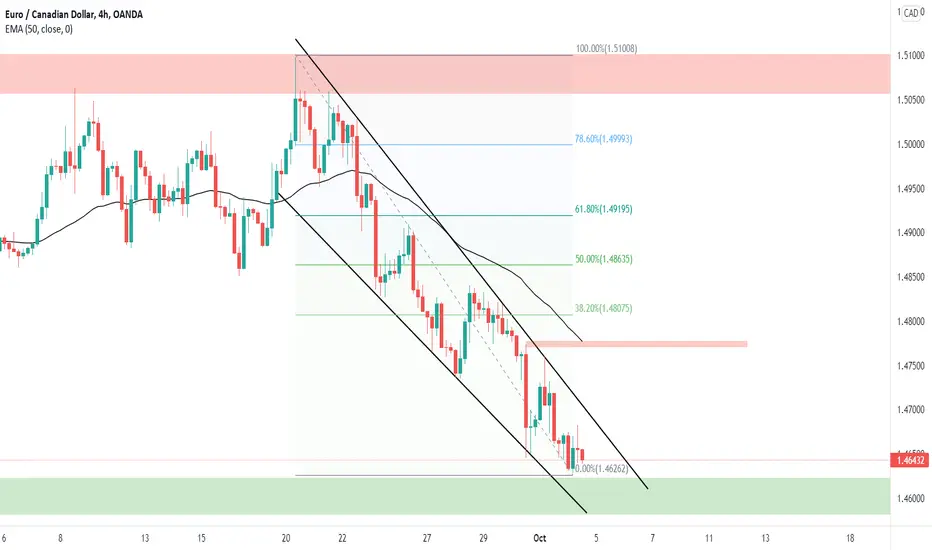
Bullish indicators:
1) Trading near major support area of 1.46100
2) Bullish Harami candle
3) Falling wedge
Bearish Indicators:
1) LL LH
2) Currently trading in downward trend
Plan A: On the bounce from the support area one can buy for the target 1.47733 first and then for the 1.48075.
Plan B: On the breaking of trendline and support one can sell for the target of 1.45826 where the major support lies.
1) Trading near major support area of 1.46100
2) Bullish Harami candle
3) Falling wedge
Bearish Indicators:
1) LL LH
2) Currently trading in downward trend
Plan A: On the bounce from the support area one can buy for the target 1.47733 first and then for the 1.48075.
Plan B: On the breaking of trendline and support one can sell for the target of 1.45826 where the major support lies.

면책사항
해당 정보와 게시물은 금융, 투자, 트레이딩 또는 기타 유형의 조언이나 권장 사항으로 간주되지 않으며, 트레이딩뷰에서 제공하거나 보증하는 것이 아닙니다. 자세한 내용은 이용 약관을 참조하세요.
면책사항
해당 정보와 게시물은 금융, 투자, 트레이딩 또는 기타 유형의 조언이나 권장 사항으로 간주되지 않으며, 트레이딩뷰에서 제공하거나 보증하는 것이 아닙니다. 자세한 내용은 이용 약관을 참조하세요.