

Hello traders,

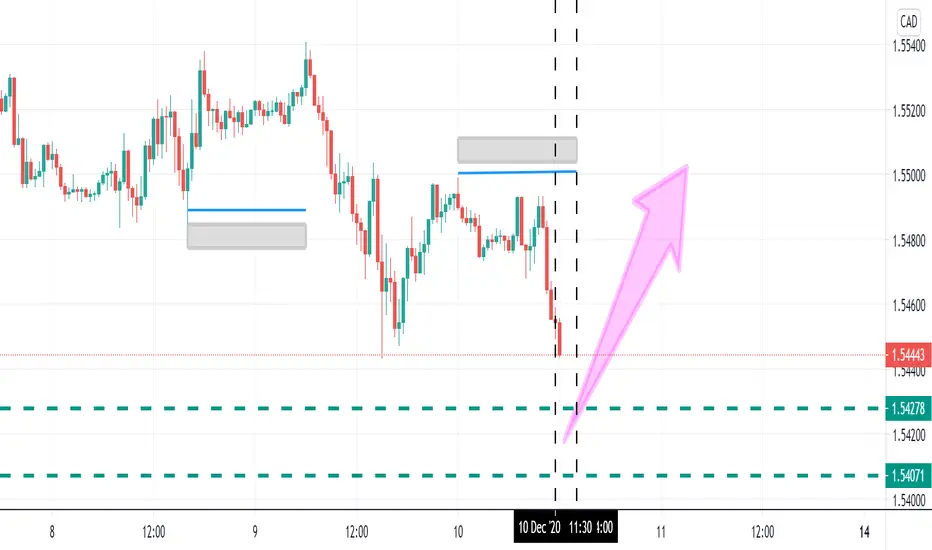
I believe there is a high probability of reversal based on the Time cycle zone (two vertical lines) in EUR/CAD.
This analysis is based on m30 timeframe but I defined the important price levels from H4 as you see in the chart above (dark background).
Time cycle zone shows best time to open position. It means the time period between two vertical lines is the best time to open position (here, buy position). But here, I prefer to wait more and get into the position as price reaches to the end of zone (second vertical line). It might also go upward before reaching to the second vertical line.
Make sure to Like and follow so you will receive notification of analysis update in a real time.
Good luck
P.S. Note that this analysis is my opinion and might be wrong. It is not a trading advice.
I believe there is a high probability of reversal based on the Time cycle zone (two vertical lines) in EUR/CAD.
This analysis is based on m30 timeframe but I defined the important price levels from H4 as you see in the chart above (dark background).
Time cycle zone shows best time to open position. It means the time period between two vertical lines is the best time to open position (here, buy position). But here, I prefer to wait more and get into the position as price reaches to the end of zone (second vertical line). It might also go upward before reaching to the second vertical line.
Make sure to Like and follow so you will receive notification of analysis update in a real time.
Good luck
P.S. Note that this analysis is my opinion and might be wrong. It is not a trading advice.
노트
for now, this time cycle zone has worked better in EUR/USD :) But I don't lose my faith, it will work in EUR/CAD too, just needs more patience ;)
let’s see what happens
거래청산: 타겟 닿음
It worked well and as I mentioned that drop in m30 became a false breakout so I'm out here, but it might continue upwards to the Pink horizontal line or more.
면책사항
해당 정보와 게시물은 금융, 투자, 트레이딩 또는 기타 유형의 조언이나 권장 사항으로 간주되지 않으며, 트레이딩뷰에서 제공하거나 보증하는 것이 아닙니다. 자세한 내용은 이용 약관을 참조하세요.
면책사항
해당 정보와 게시물은 금융, 투자, 트레이딩 또는 기타 유형의 조언이나 권장 사항으로 간주되지 않으며, 트레이딩뷰에서 제공하거나 보증하는 것이 아닙니다. 자세한 내용은 이용 약관을 참조하세요.