

Wow. There are so many interesting things going on here from a technical analysis perspective.
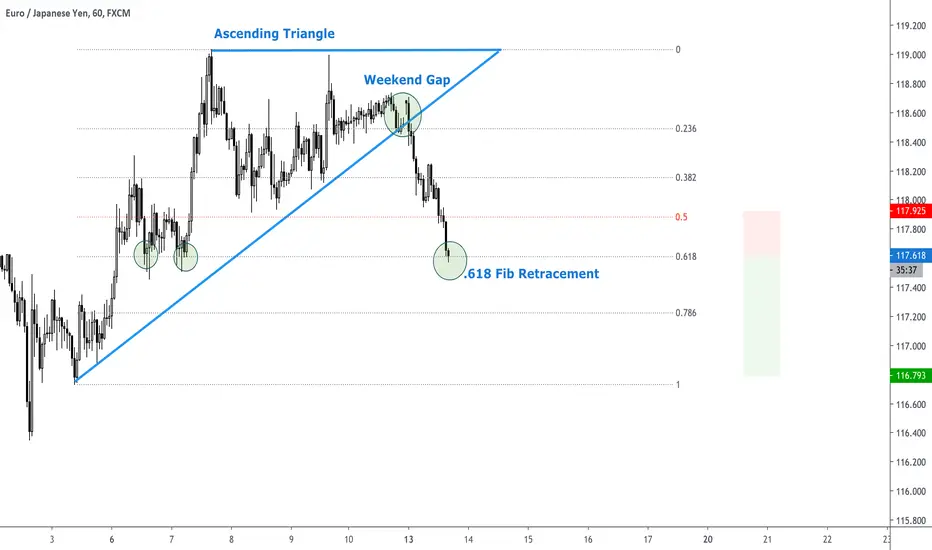
First of all, EURJPY has been inside an ascending triangle. This is usually a bullish pattern. The price closed right on the edge near the bottom support trendline, but then as soon as the markets opened it looked like the price was going to adhere to the triangle.
However, soon after a huge spike downwards broke through the bottom support trendline of the triangle and immediately a strong downtrend was observed.
Now the price is at the .618 fib retracement and has to make another decision. Will it bounce back up now and continue its uptrend? Or will it come back down and test more serious fib levels such as the .786.
Even though the price has dropped a lot recently, I still am bearish here and don't see any technicals to say there is a reversal coming. I am still bearish and expect the price to drop further.
There is a bit of support on the .618 from prices earlier around 6th and 7th of April, so we can wait first to see if the prices drop below that. If they do, I think we can expect a longer downturn.
Follow me for consistent high quality updates, with clear explanations and charts.
Please like this post to support me.
- Trading Guru
--------------------------------------------------------------
Disclaimer!
This post does not provide financial advice. It is for educational purposes only!
First of all, EURJPY has been inside an ascending triangle. This is usually a bullish pattern. The price closed right on the edge near the bottom support trendline, but then as soon as the markets opened it looked like the price was going to adhere to the triangle.
However, soon after a huge spike downwards broke through the bottom support trendline of the triangle and immediately a strong downtrend was observed.
Now the price is at the .618 fib retracement and has to make another decision. Will it bounce back up now and continue its uptrend? Or will it come back down and test more serious fib levels such as the .786.
Even though the price has dropped a lot recently, I still am bearish here and don't see any technicals to say there is a reversal coming. I am still bearish and expect the price to drop further.
There is a bit of support on the .618 from prices earlier around 6th and 7th of April, so we can wait first to see if the prices drop below that. If they do, I think we can expect a longer downturn.
Follow me for consistent high quality updates, with clear explanations and charts.
Please like this post to support me.
- Trading Guru
--------------------------------------------------------------
Disclaimer!
This post does not provide financial advice. It is for educational purposes only!
액티브 트레이드
Wow! The price broke through that fib retracement like a rocket. The strong downtrend continues, and we are now active in our trade. Let's see how this plays out.

Free crypto scanner on Telegram (35k members):
t.me/CryptoScanner100eyes
t.me/CryptoScanner100eyes
면책사항
해당 정보와 게시물은 금융, 투자, 트레이딩 또는 기타 유형의 조언이나 권장 사항으로 간주되지 않으며, 트레이딩뷰에서 제공하거나 보증하는 것이 아닙니다. 자세한 내용은 이용 약관을 참조하세요.
Free crypto scanner on Telegram (35k members):
t.me/CryptoScanner100eyes
t.me/CryptoScanner100eyes
면책사항
해당 정보와 게시물은 금융, 투자, 트레이딩 또는 기타 유형의 조언이나 권장 사항으로 간주되지 않으며, 트레이딩뷰에서 제공하거나 보증하는 것이 아닙니다. 자세한 내용은 이용 약관을 참조하세요.