

Overview
___________________________________________________________
Definition
___________________________________________________________
Key Points
___________________________________________________________
Chart Explanation
___________________________________________________________
Summary
___________________________________________________________
Why It Matters
___________________________________________________________
Conclusion
___________________________________________________________
Disclaimer
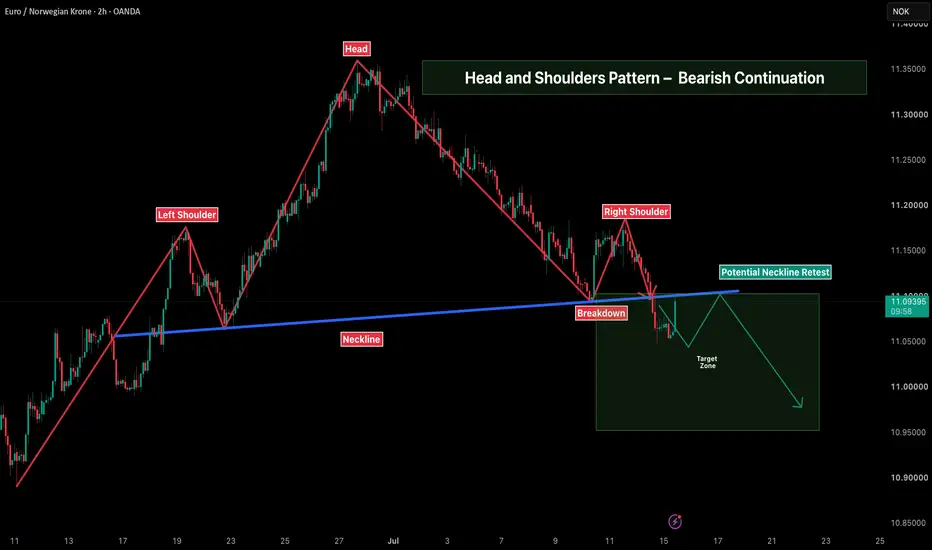
The Head and Shoulders pattern is one of the most recognized bearish reversal formations in technical analysis. In this chart, price has formed a Left Shoulder, a higher Head, and a Right Shoulder before breaking below the neckline. The current structure suggests that sellers have gained momentum, while a possible retest of the neckline could provide additional confirmation if the pattern remains valid.
___________________________________________________________
Definition
A Head and Shoulders pattern is a price formation consisting of three peaks:
Left Shoulder: The first peak followed by a pullback.
Head: A higher peak followed by another decline.
Right Shoulder: A lower peak that fails to exceed the head.
Neckline: A support line connecting the swing lows. A close below this level is commonly viewed as confirmation of the pattern.
___________________________________________________________
Key Points
• Price formed a clear Left Shoulder, Head, and Right Shoulder.
• The neckline acted as an important support level before the breakdown.
• A close below the neckline increases the probability of continued bearish momentum.
• Price may revisit the neckline before deciding its next directional move.
• A sustained move back above the neckline may weaken the current bearish structure.
___________________________________________________________
Chart Explanation
• The Left Shoulder marked the first attempt by buyers before a pullback.
• Buyers pushed price to a new high, creating the Head.
• The Right Shoulder formed with a lower high, indicating reduced buying strength.
• Price then broke below the neckline, suggesting that sellers gained control.
• The illustrated path shows one possible scenario where price retests the neckline before continuing lower. This projection is for educational purposes and is not a prediction of future price movement.
___________________________________________________________
Summary
The current chart displays a completed Head and Shoulders pattern with a neckline breakdown. As long as price remains below the neckline, the bearish structure remains intact. Market participants may watch future price action around the neckline for additional confirmation or signs of invalidation.
___________________________________________________________
Why It Matters
• Recognizing chart patterns can help identify potential trend changes.
• It helps traders understand shifts in market sentiment.
• It highlights important technical levels for planning entries, exits, and risk management.
• Waiting for confirmation may reduce the likelihood of acting on false signals..
___________________________________________________________
Conclusion
This chart highlights a classic Head and Shoulders structure followed by a neckline breakdown. Whether the market continues lower or invalidates the setup will depend on future price action. As with any technical pattern, confirmation and proper risk management are essential before making trading decisions.
___________________________________________________________
Disclaimer
📘 For educational purposes only.
🙅 Not SEBI registered.
❌ Not a buy/sell recommendation.
🧠 Purely a learning resource.
📊 Not Financial Advice

Pine Script Developer • Market Analysis
면책사항
해당 정보와 게시물은 금융, 투자, 트레이딩 또는 기타 유형의 조언이나 권장 사항으로 간주되지 않으며, 트레이딩뷰에서 제공하거나 보증하는 것이 아닙니다. 자세한 내용은 이용 약관을 참조하세요.
Pine Script Developer • Market Analysis
면책사항
해당 정보와 게시물은 금융, 투자, 트레이딩 또는 기타 유형의 조언이나 권장 사항으로 간주되지 않으며, 트레이딩뷰에서 제공하거나 보증하는 것이 아닙니다. 자세한 내용은 이용 약관을 참조하세요.