

First of all note that the GBPNZD chart is similar so you can decide the one you want to trade.
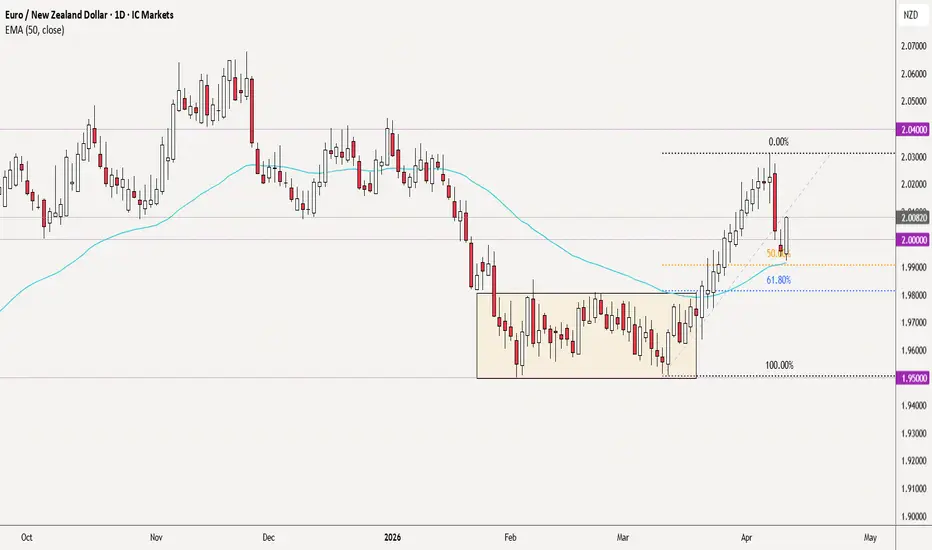
EURNZD came out from consolidation on 20 March and proceeded to rise – the move continued until last week. More than 10 consecutive bullish candles in a move does show total control of the market by the bulls. We then had a 50% retracement and as that humungous bullish candle of Fri shows, the bullish trend is likely resuming. This engulfing candle makes me sit up and take notice – it’s not often that we get to see such a candle on the daily chart.

Moving on to the H4 chart we note that price has found support in the 2.000 area. It actually has retested that support already but I think we will get another pullback that will set up the next bullish move. Price is above the 50 ema on the D1, H4 and H1 charts and this provided confluence to my bullish bias.
Trade parameters
The markets are currently unusually volatile, sudden unexpected spikes in either direction is common. Trading with smaller position size and giving extra space for stops is recommended.
Entry – I will look for a small retracement and will try to take a long as soon as I see some bullish evidence.
Stop – below the nearest swing low (and the support zone).
Target(s) depend on the trading style, but 2.020 and 2.040 seem logical. I would stay flexible and remain open to taking profit and re-entering if price action confirms a continued move.
General comment
Nothing in trading is ever 100%, so please allow price action to fully develop in your desired direction before executing a trade.
This is not a trade recommendation
EURNZD came out from consolidation on 20 March and proceeded to rise – the move continued until last week. More than 10 consecutive bullish candles in a move does show total control of the market by the bulls. We then had a 50% retracement and as that humungous bullish candle of Fri shows, the bullish trend is likely resuming. This engulfing candle makes me sit up and take notice – it’s not often that we get to see such a candle on the daily chart.
Moving on to the H4 chart we note that price has found support in the 2.000 area. It actually has retested that support already but I think we will get another pullback that will set up the next bullish move. Price is above the 50 ema on the D1, H4 and H1 charts and this provided confluence to my bullish bias.
Trade parameters
The markets are currently unusually volatile, sudden unexpected spikes in either direction is common. Trading with smaller position size and giving extra space for stops is recommended.
Entry – I will look for a small retracement and will try to take a long as soon as I see some bullish evidence.
Stop – below the nearest swing low (and the support zone).
Target(s) depend on the trading style, but 2.020 and 2.040 seem logical. I would stay flexible and remain open to taking profit and re-entering if price action confirms a continued move.
General comment
Nothing in trading is ever 100%, so please allow price action to fully develop in your desired direction before executing a trade.
This is not a trade recommendation
액티브 트레이드
On the D1, this pair is still bullish, but in all probabilities this will be a losing trade. I have just tightened my stop to limit my loss to 0.77%. If this short term support is broken, I don't want to hold it more.

면책사항
해당 정보와 게시물은 금융, 투자, 트레이딩 또는 기타 유형의 조언이나 권장 사항으로 간주되지 않으며, 트레이딩뷰에서 제공하거나 보증하는 것이 아닙니다. 자세한 내용은 이용 약관을 참조하세요.
면책사항
해당 정보와 게시물은 금융, 투자, 트레이딩 또는 기타 유형의 조언이나 권장 사항으로 간주되지 않으며, 트레이딩뷰에서 제공하거나 보증하는 것이 아닙니다. 자세한 내용은 이용 약관을 참조하세요.