

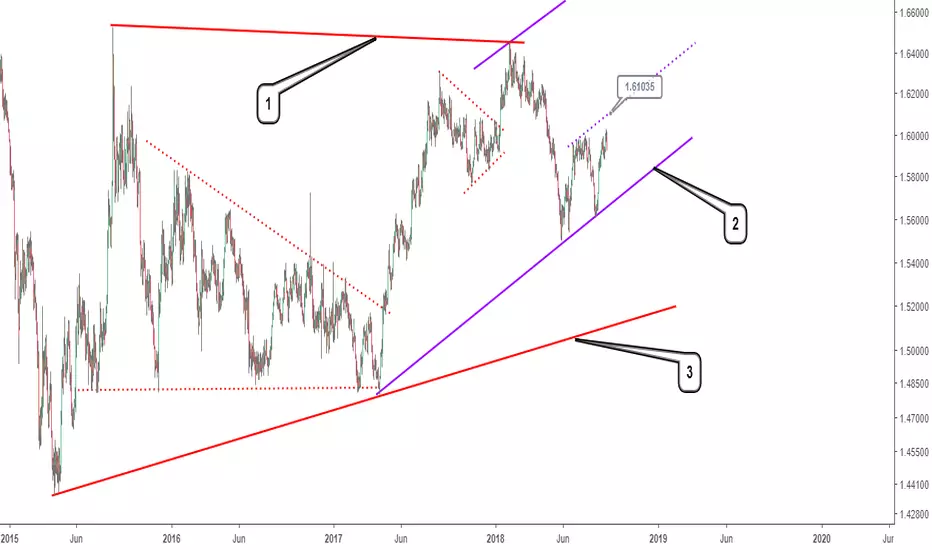
Over 3 years of price action in the EURSGD is captured in this analysis from April 13, 2015 to present date. Commentary is provided based on the numbers indicated on the chart.
(1) Current, active resistance in the EURSGD with the most recent test occurring on February 5, 2018. The bearish trendline further extrapolated is expected to offer future resistance, while a break out above the trendline implies more bullish action.
(2) This is established by connecting the price low at ~1.47820 and 1.56136. The current swing upwards in price 1.56136 also makes it important to focus on the bullish channel as shown in blue lines. The dotted blue line provides another possibility of a smaller bullish channel that can serve as a termination of price action prior to a downturn.
(3) Main bullish trendline in the EURSGD established since April 17, 2017. A break in the lower boundary of the bullish channel, and also below 1.56136 could see the EURSGD return to the vicinity of the main trendline.
(1) Current, active resistance in the EURSGD with the most recent test occurring on February 5, 2018. The bearish trendline further extrapolated is expected to offer future resistance, while a break out above the trendline implies more bullish action.
(2) This is established by connecting the price low at ~1.47820 and 1.56136. The current swing upwards in price 1.56136 also makes it important to focus on the bullish channel as shown in blue lines. The dotted blue line provides another possibility of a smaller bullish channel that can serve as a termination of price action prior to a downturn.
(3) Main bullish trendline in the EURSGD established since April 17, 2017. A break in the lower boundary of the bullish channel, and also below 1.56136 could see the EURSGD return to the vicinity of the main trendline.

관련 발행물
면책사항
해당 정보와 게시물은 금융, 투자, 트레이딩 또는 기타 유형의 조언이나 권장 사항으로 간주되지 않으며, 트레이딩뷰에서 제공하거나 보증하는 것이 아닙니다. 자세한 내용은 이용 약관을 참조하세요.
관련 발행물
면책사항
해당 정보와 게시물은 금융, 투자, 트레이딩 또는 기타 유형의 조언이나 권장 사항으로 간주되지 않으며, 트레이딩뷰에서 제공하거나 보증하는 것이 아닙니다. 자세한 내용은 이용 약관을 참조하세요.