

EURO/USD
RSI SIGNAL ANALYSIS
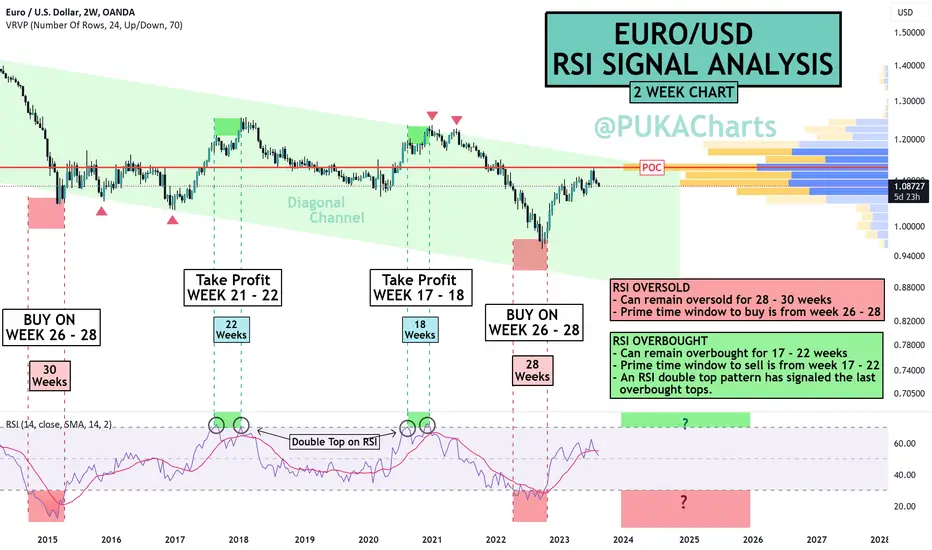
- Diagonal parallel channel acting as confinement zone
for price, good for timing buys/sells and for stops
above or below.
- Red zones on the chart are oversold levels and green
are overbought.
RSI OVERSOLD
- Can remain oversold for 28 - 30 weeks
- Prime time window to buy is from week 26 - 28
RSI OVERBOUGHT
- Can remain overbought for 17 - 22 weeks
- Prime time window to sell is from week 17 - 22
- An RSI double top pattern has signaled the last
overbought tops.
You can also clearly see the relevance of the POC Line which price oscillates around or has trouble with breaching.
We can observe what happens the next time the RSI is oversold or overbought and maybe we can use these weekly time windows to better gauge a buy or sell opportunity.
PUKA
RSI SIGNAL ANALYSIS
- Diagonal parallel channel acting as confinement zone
for price, good for timing buys/sells and for stops
above or below.
- Red zones on the chart are oversold levels and green
are overbought.
RSI OVERSOLD
- Can remain oversold for 28 - 30 weeks
- Prime time window to buy is from week 26 - 28
RSI OVERBOUGHT
- Can remain overbought for 17 - 22 weeks
- Prime time window to sell is from week 17 - 22
- An RSI double top pattern has signaled the last
overbought tops.
You can also clearly see the relevance of the POC Line which price oscillates around or has trouble with breaching.
We can observe what happens the next time the RSI is oversold or overbought and maybe we can use these weekly time windows to better gauge a buy or sell opportunity.
PUKA

면책사항
해당 정보와 게시물은 금융, 투자, 트레이딩 또는 기타 유형의 조언이나 권장 사항으로 간주되지 않으며, 트레이딩뷰에서 제공하거나 보증하는 것이 아닙니다. 자세한 내용은 이용 약관을 참조하세요.
면책사항
해당 정보와 게시물은 금융, 투자, 트레이딩 또는 기타 유형의 조언이나 권장 사항으로 간주되지 않으며, 트레이딩뷰에서 제공하거나 보증하는 것이 아닙니다. 자세한 내용은 이용 약관을 참조하세요.