

Amidst the whirlwind of events, the Euro-Dollar chart stands strong with a bullish trajectory. 📈 The weekly chart showcases a series of resolute highs, fortified by untested supports, painting an appealing canvas for potential buying opportunities. 🎨
Zooming into the daily chart, a pivotal support at 1.0834 shelters the bullish sentiment. A breach here could cast shadows on the prevailing optimism. However, the four-hour and one-hour charts echo a touch of bearish undertones, contrasting with the larger bullish narrative. 📉🕒
Within this landscape, the spotlight is on a possible buying chance, defying the bearish signals of the lower timeframes.
Back on the weekly chart, attention focuses on 1.1232 as a battlefield for counter-trend short positions. Conversely, trend traders set their sights on 1.0698, a fortress for ultimate pullback aspirations. On the daily chart, anchored on support, a magic candle confirmation beckons before diving into trades. 🛡️🕯️
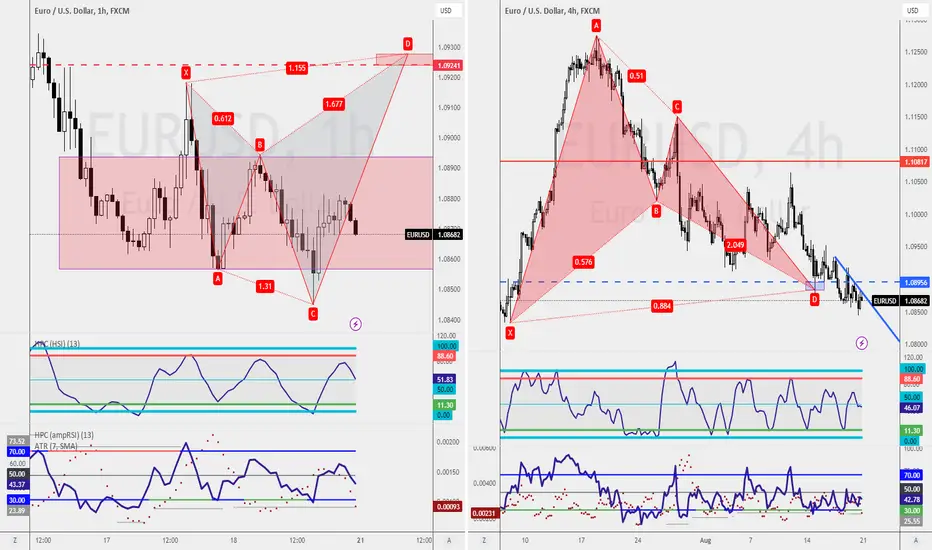
Shifting gears to the four-hour chart, a bullish bat pattern is poised, brimming with confirmation yet diving deeper. Patient traders await a trend line breach and RSI divergence as signs for opportune action. 🦇📊
The one-hour chart reveals a potential shorting scenario through a bearish shark pattern. The saga unfolds from point C, advocating patience for the sell zone breach, a signal for bearish entry. 🦈

🧑🏫Analysis now at Substack
🕒 Work 15mins to earn additional income
🏦 Qualify Financial Analyst within 90days
🎤 Keynote Speaker
🧠 21yrs in trading
🚀 Get into our Discord to receive our live market analysis!
discord.gg/AKDr9vPqH7
🕒 Work 15mins to earn additional income
🏦 Qualify Financial Analyst within 90days
🎤 Keynote Speaker
🧠 21yrs in trading
🚀 Get into our Discord to receive our live market analysis!
discord.gg/AKDr9vPqH7
면책사항
해당 정보와 게시물은 금융, 투자, 트레이딩 또는 기타 유형의 조언이나 권장 사항으로 간주되지 않으며, 트레이딩뷰에서 제공하거나 보증하는 것이 아닙니다. 자세한 내용은 이용 약관을 참조하세요.