

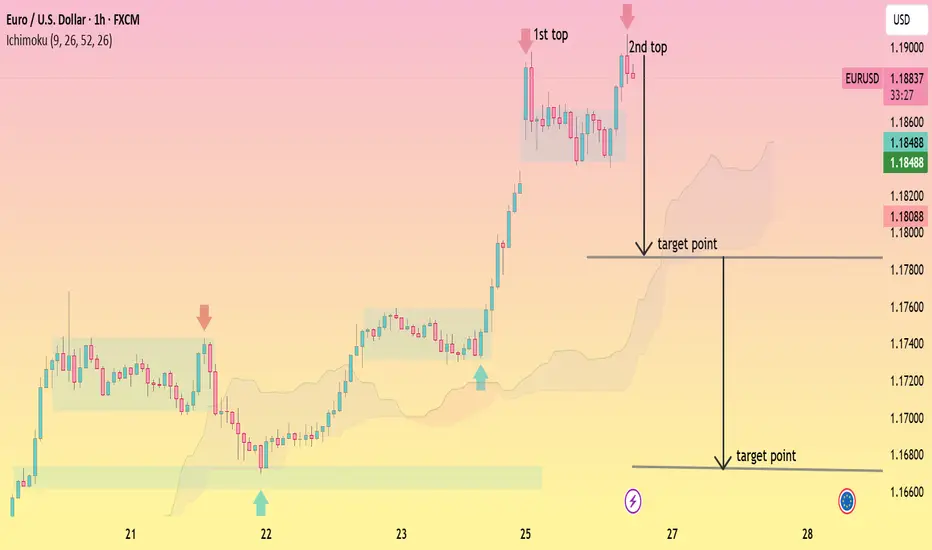
EURUSD, (1H chart pattern).
Clear double top (“1st top” and “2nd top”) around 1.1900
Price is extended above the Ichimoku cloud → pullback / correction likely
Me’ve already marked downside target zones, which makes sense
Logical downside targets
Based on structure + support levels:
🎯 Target 1 (conservative)
≈ 1.1800
Prior consolidation area
Psychological round number
Likely first reaction / partial profit zone
🎯 Target 2 (main target)
≈ 1.1680 – 1.1700
Strong previous support
Near cloud base / value area
Matches measured pullback after impulsive move
In short
TP1: 1.1800
TP2: 1.1680–1.1700
If price breaks and holds above 1.1900, the double-top idea is invalid and bearish targets are off.
If my want, I can also:
Suggest stop-loss placement
Do a risk-reward breakdown
Or map bullish targets if it breaks higher 📈
Clear double top (“1st top” and “2nd top”) around 1.1900
Price is extended above the Ichimoku cloud → pullback / correction likely
Me’ve already marked downside target zones, which makes sense
Logical downside targets
Based on structure + support levels:
🎯 Target 1 (conservative)
≈ 1.1800
Prior consolidation area
Psychological round number
Likely first reaction / partial profit zone
🎯 Target 2 (main target)
≈ 1.1680 – 1.1700
Strong previous support
Near cloud base / value area
Matches measured pullback after impulsive move
In short
TP1: 1.1800
TP2: 1.1680–1.1700
If price breaks and holds above 1.1900, the double-top idea is invalid and bearish targets are off.
If my want, I can also:
Suggest stop-loss placement
Do a risk-reward breakdown
Or map bullish targets if it breaks higher 📈
액티브 트레이드
active active 
관련 발행물
면책사항
해당 정보와 게시물은 금융, 투자, 트레이딩 또는 기타 유형의 조언이나 권장 사항으로 간주되지 않으며, 트레이딩뷰에서 제공하거나 보증하는 것이 아닙니다. 자세한 내용은 이용 약관을 참조하세요.
관련 발행물
면책사항
해당 정보와 게시물은 금융, 투자, 트레이딩 또는 기타 유형의 조언이나 권장 사항으로 간주되지 않으며, 트레이딩뷰에서 제공하거나 보증하는 것이 아닙니다. 자세한 내용은 이용 약관을 참조하세요.