

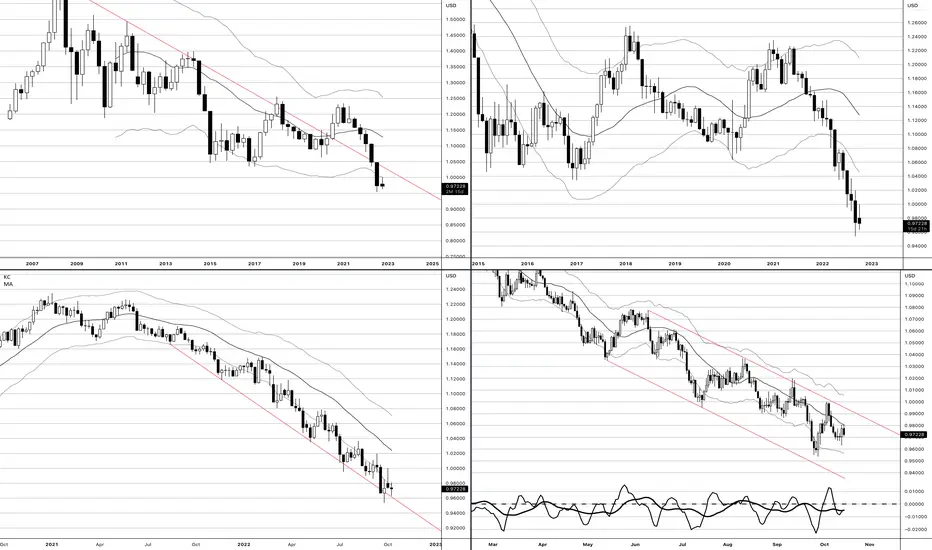
As noted last week I'm watching the dollar for the short position trade, I'm going to put on an entry here off the daily.
Quarterly:
- 10 year down trend turning into a flat market.
Monthly:
- Basically a year and a half of straight down with no healthy correction to speak of.
- 500 pips from 2 year average.
Weekly:
- 3 pushes overshooting the original trend. Most recent swing has stepped up back into the range.
Daily:
- Notice the parallel channel drawn off the most recent lower lows of this action.
- Notice the failed breakout of the top side resulting in the most recent lower low followed by a step up.
- Momentum swings on the most recent price action worth noting.
- Notice how the top Keltner channel is well outside of the the top price trend line but well within the bottom? I suspect we might be at the turning point here.
Quarterly:
- 10 year down trend turning into a flat market.
Monthly:
- Basically a year and a half of straight down with no healthy correction to speak of.
- 500 pips from 2 year average.
Weekly:
- 3 pushes overshooting the original trend. Most recent swing has stepped up back into the range.
Daily:
- Notice the parallel channel drawn off the most recent lower lows of this action.
- Notice the failed breakout of the top side resulting in the most recent lower low followed by a step up.
- Momentum swings on the most recent price action worth noting.
- Notice how the top Keltner channel is well outside of the the top price trend line but well within the bottom? I suspect we might be at the turning point here.

면책사항
해당 정보와 게시물은 금융, 투자, 트레이딩 또는 기타 유형의 조언이나 권장 사항으로 간주되지 않으며, 트레이딩뷰에서 제공하거나 보증하는 것이 아닙니다. 자세한 내용은 이용 약관을 참조하세요.
면책사항
해당 정보와 게시물은 금융, 투자, 트레이딩 또는 기타 유형의 조언이나 권장 사항으로 간주되지 않으며, 트레이딩뷰에서 제공하거나 보증하는 것이 아닙니다. 자세한 내용은 이용 약관을 참조하세요.