

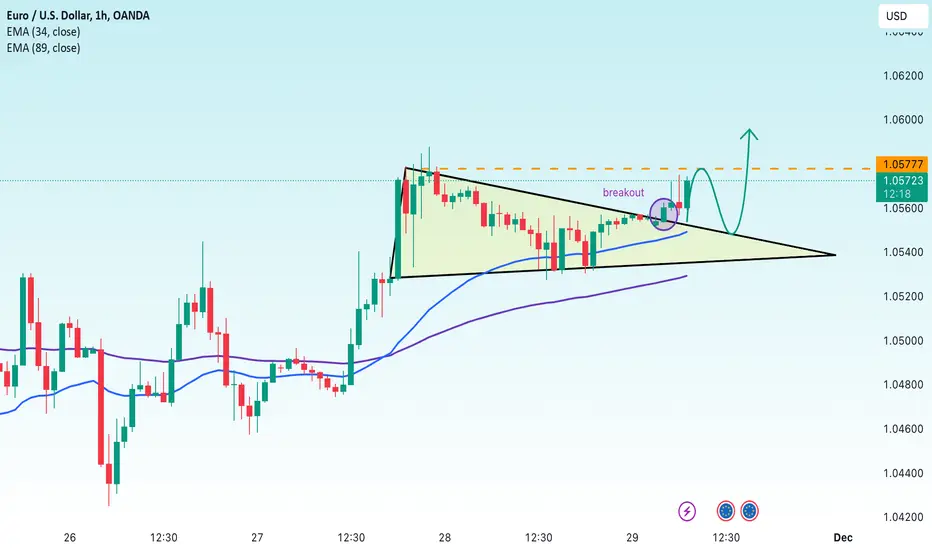
The EUR/USD 1-hour chart shows a triangle pattern forming, which is a sign of accumulation before a breakout. A breakout of this pattern to the upside, as it has recently done, could signal that the next bullish trend is likely to continue.
The price has broken above the EMA 34 and is approaching the EMA 89, which suggests that the bullish trend may be increasing. If the price sustains above the EMA 89 and continues to break above the previously drawn horizontal resistance around 1.0577, we can expect a significant upside move.
Personally, I would advise traders to closely monitor the price interaction with the EMA 89 and the resistance at 1.0577 in the coming hours to determine a suitable trading strategy. At the same time, it is indispensable to follow economic news that may affect EUR/USD to get a comprehensive view of the current market trend.
The price has broken above the EMA 34 and is approaching the EMA 89, which suggests that the bullish trend may be increasing. If the price sustains above the EMA 89 and continues to break above the previously drawn horizontal resistance around 1.0577, we can expect a significant upside move.
Personally, I would advise traders to closely monitor the price interaction with the EMA 89 and the resistance at 1.0577 in the coming hours to determine a suitable trading strategy. At the same time, it is indispensable to follow economic news that may affect EUR/USD to get a comprehensive view of the current market trend.

관련 발행물
면책사항
해당 정보와 게시물은 금융, 투자, 트레이딩 또는 기타 유형의 조언이나 권장 사항으로 간주되지 않으며, 트레이딩뷰에서 제공하거나 보증하는 것이 아닙니다. 자세한 내용은 이용 약관을 참조하세요.
관련 발행물
면책사항
해당 정보와 게시물은 금융, 투자, 트레이딩 또는 기타 유형의 조언이나 권장 사항으로 간주되지 않으며, 트레이딩뷰에서 제공하거나 보증하는 것이 아닙니다. 자세한 내용은 이용 약관을 참조하세요.