롱
ExideInd1!
27-11
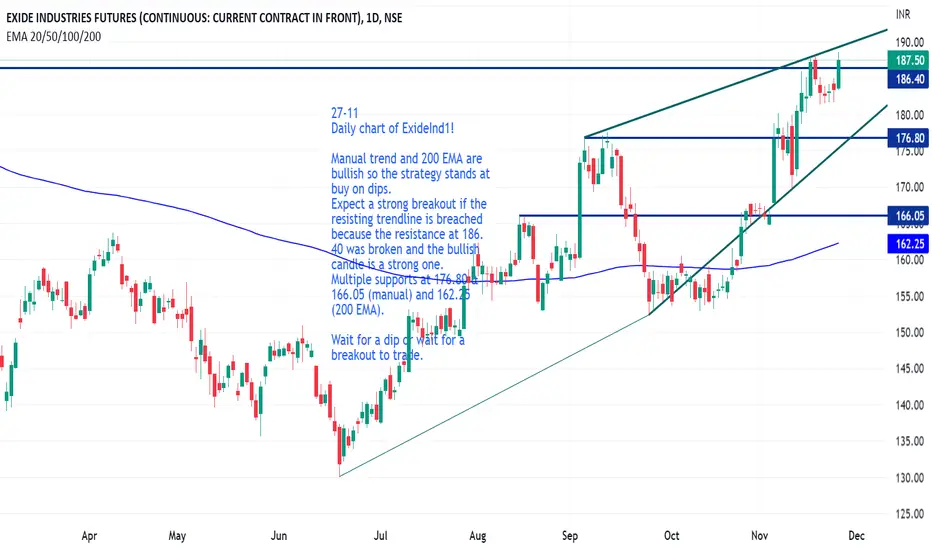
Daily chart of ExideInd1!
Manual trend and 200 EMA are bullish so the strategy stands at buy on dips.
Expect a strong breakout if the resisting trendline is breached because the resistance at 186.40 was broken and the bullish candle is a strong one.
Multiple supports at 176.80 & 166.05 (manual) and 162.25 (200 EMA).
Wait for a dip or wait for a breakout to trade.
Daily chart of ExideInd1!
Manual trend and 200 EMA are bullish so the strategy stands at buy on dips.
Expect a strong breakout if the resisting trendline is breached because the resistance at 186.40 was broken and the bullish candle is a strong one.
Multiple supports at 176.80 & 166.05 (manual) and 162.25 (200 EMA).
Wait for a dip or wait for a breakout to trade.

면책사항
해당 정보와 게시물은 금융, 투자, 트레이딩 또는 기타 유형의 조언이나 권장 사항으로 간주되지 않으며, 트레이딩뷰에서 제공하거나 보증하는 것이 아닙니다. 자세한 내용은 이용 약관을 참조하세요.
면책사항
해당 정보와 게시물은 금융, 투자, 트레이딩 또는 기타 유형의 조언이나 권장 사항으로 간주되지 않으며, 트레이딩뷰에서 제공하거나 보증하는 것이 아닙니다. 자세한 내용은 이용 약관을 참조하세요.