
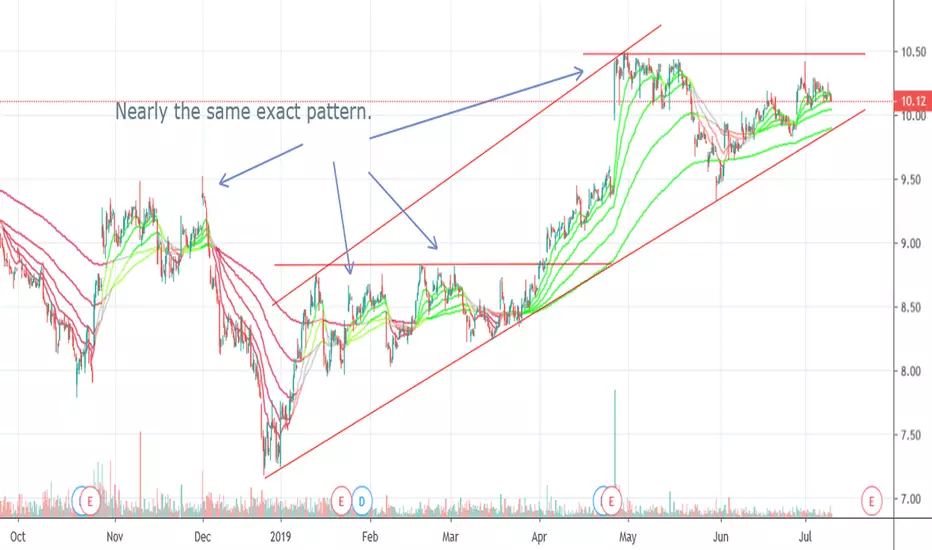
It's nearly identical. Interestingly, the first on the left has a large sell spike. The one of the far right a large buy spike. 3 pops then a dip repeat throughout. The trend lines may not be exact, but you can see the 200 bumping the trend line on the right like the previous identical pattern.
After each 3 top pop, there is a cascading effect that sends the stock over the 100 and 200ema. The large buy spike is over 4million. This one could go either way. If I were to guess, it will roll over and break the 200 and trend line, setting up similar pattern for a possible short.
After each 3 top pop, there is a cascading effect that sends the stock over the 100 and 200ema. The large buy spike is over 4million. This one could go either way. If I were to guess, it will roll over and break the 200 and trend line, setting up similar pattern for a possible short.
노트
How's that for a prediction? Will probably move sideways or slightly down for a few days.
노트
Definitely needs to hold this position or go up a bit.
면책사항
해당 정보와 게시물은 금융, 투자, 트레이딩 또는 기타 유형의 조언이나 권장 사항으로 간주되지 않으며, 트레이딩뷰에서 제공하거나 보증하는 것이 아닙니다. 자세한 내용은 이용 약관을 참조하세요.
면책사항
해당 정보와 게시물은 금융, 투자, 트레이딩 또는 기타 유형의 조언이나 권장 사항으로 간주되지 않으며, 트레이딩뷰에서 제공하거나 보증하는 것이 아닙니다. 자세한 내용은 이용 약관을 참조하세요.