
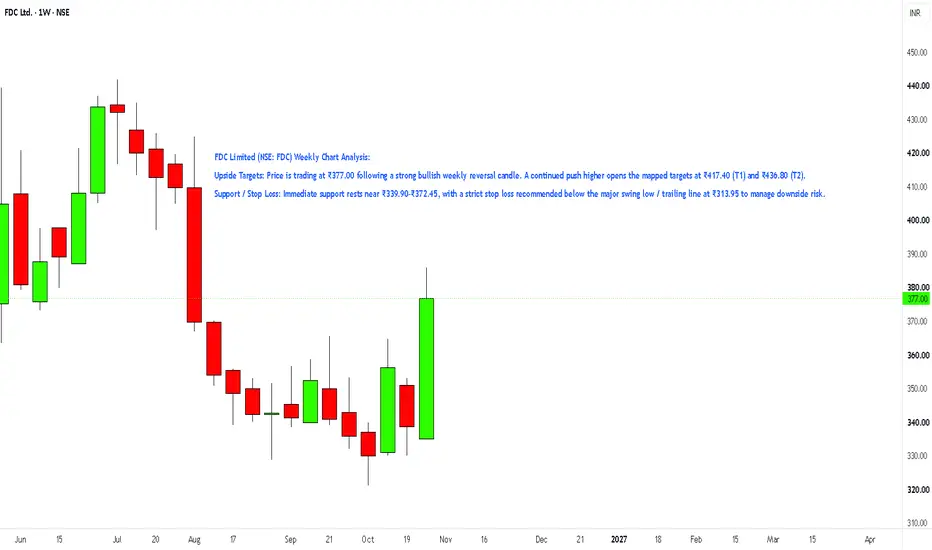
FDC Limited (NSE: FDC) Weekly Chart Analysis:
Upside Targets: Price is trading at ₹377.00 following a strong bullish weekly reversal candle. A continued push higher opens the mapped targets at ₹417.40 (T1) and ₹436.80 (T2).
Support / Stop Loss: Immediate support rests near ₹339.90–₹372.45, with a strict stop loss recommended below the major swing low / trailing line at ₹313.95 to manage downside risk.
Upside Targets: Price is trading at ₹377.00 following a strong bullish weekly reversal candle. A continued push higher opens the mapped targets at ₹417.40 (T1) and ₹436.80 (T2).
Support / Stop Loss: Immediate support rests near ₹339.90–₹372.45, with a strict stop loss recommended below the major swing low / trailing line at ₹313.95 to manage downside risk.

Automated Tools/Indicators/Screeners available at kkonline.org/nimblrta
면책사항
해당 정보와 게시물은 금융, 투자, 트레이딩 또는 기타 유형의 조언이나 권장 사항으로 간주되지 않으며, 트레이딩뷰에서 제공하거나 보증하는 것이 아닙니다. 자세한 내용은 이용 약관을 참조하세요.
Automated Tools/Indicators/Screeners available at kkonline.org/nimblrta
면책사항
해당 정보와 게시물은 금융, 투자, 트레이딩 또는 기타 유형의 조언이나 권장 사항으로 간주되지 않으며, 트레이딩뷰에서 제공하거나 보증하는 것이 아닙니다. 자세한 내용은 이용 약관을 참조하세요.